


 这篇博客介绍了matplotlib的基础使用,包括2D绘图、折线图、散点图、柱形图和饼状图的绘制方法,以及如何设置颜色、标记、线型、刻度范围和标签。还讲解了plt.subplots()在创建多个图表时的优势,以及图例的添加和位置调整。
1、matplotlib简介
Python 的 2D绘图库,为Python构建一个Matlab式的绘图接口,通过 Matplotlib,开发者可以仅需要几行代码,便可以生成绘图,直方图,功率谱,条形图,错误图,散点图等
2、matplotlib的使用
(1)折线图
import matplotlib.pyplot as plt
import numpy as np

fig = plt.figure()
print(type(fig))
<class 'matplotlib.figure.Figure'>
arr = np.random.randn(100)
plt.plot(arr)
plt.show()
Subplot 可以通过add_subplot来分割figure,表示可以在figure的不同位置上作图 fig.
add_subplot(a, b, c) a,b 表示将fig分割成 a*b 的区域 c 表示当前选中要操作的区域,
注意:从1开始编号(不是从0开始)
plot 绘图的区域是最后一次指定subplot的位置 (jupyter notebook里不能正确显示)
fig = plt.figure()
ax1 = fig.add_subplot(2, 2, 1)
ax2 = fig.add_subplot(2, 2, 2)
ax3 = fig.add_subplot(2, 2, 3)
ax4 = fig.add_subplot(2, 2, 4)
ax1.plot(np.random.randn(100))
ax2.plot(np.random.randn(100))
ax3.plot(np.random.randn(100))
ax4.plot(np.random.randn(100))
plt.show()

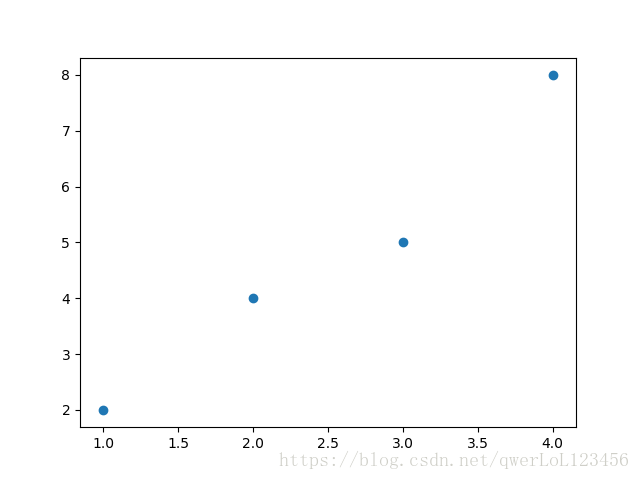
(2)散点图
# 散点图 scatter方法 参数1:x轴的坐标 参数2: y轴的坐标
x = [1, 2, 3, 4]
y = [2, 4, 5, 8]
plt.scatter(x, y)
plt.show()
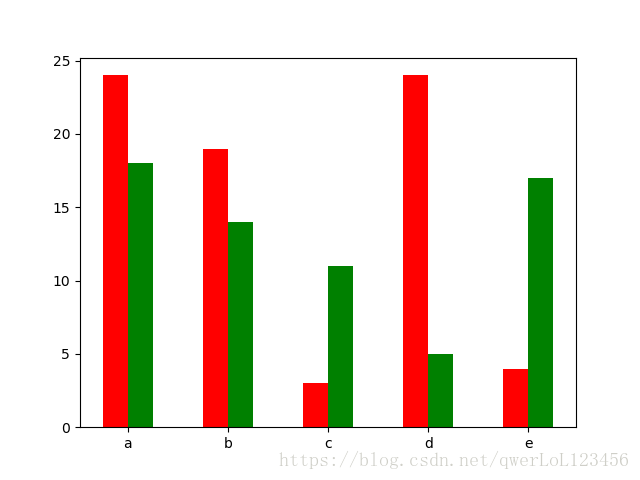
(3)柱形图bar
x = np.arange(5)    # [0 1 2 3 4]
print(np.random.randint(1, 25, size=(2, 5)))
y1, y2 = np.random.randint(1, 25, size=(2, 5))
# 宽度,偏移量
width = 0.25
ax = plt.subplot(1, 1, 1)
ax.bar(x+0.125, y1, width, color='r')
ax.bar(x+width+0.125, y2, width, color='g')
ax.set_xticks(x+width)
ax.set_xticklabels(['a', 'b', 'c', 'd', 'e'])
plt.show()
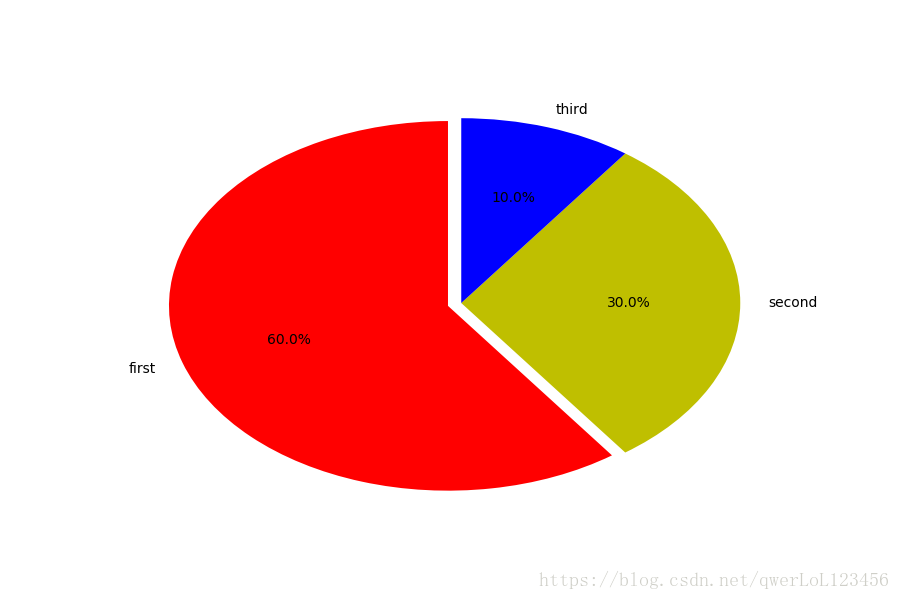
(4)饼状图
plt.pie(sizes,explode=explode,labels=labels,colors=colors,labeldistance = 1.1,autopct = '%3.1f%%',shadow = False,startangle = 90,pctdistance = 0.6)
sizes:每个标签占多大,会自动去算百分比
explode:将某部分爆炸出来, 使用括号,将第一块分割出来,数值的大小是分割出来的与其他两块的间隙
labels:定义饼状图的标签,标签是列表
Colors:每部分的颜色
labeldistance,文本的位置离远点有多远,1.1指1.1倍半径的位置
autopct,圆里面的文本格式,%3.1f%%表示整数有三位,小数有一位的浮点数
shadow,饼是否有阴影
startangle:起始角度,0,表示从0开始逆时针转,为第一块。一般选择从90度开始比较好看
pctdistance:百分比的text离圆心的距离
返回值:p_texts饼图内部文本的,l_texts饼图外label的文本
plt.figure(figsize=(9, 6))
labels = ['first', 'second', 'third']
sizes = [60, 30, 10]
colors = ['r', 'y', 'b']
explode = (0.05, 0, 0)
patches, l_text, p_text = plt.pie(sizes, explode=explode, labels=labels, colors=colors, labeldistance=1.1,
                                  autopct='%3.1f%%', shadow=False, startangle=90, pctdistance=0.6)
plt.show()
3、其他
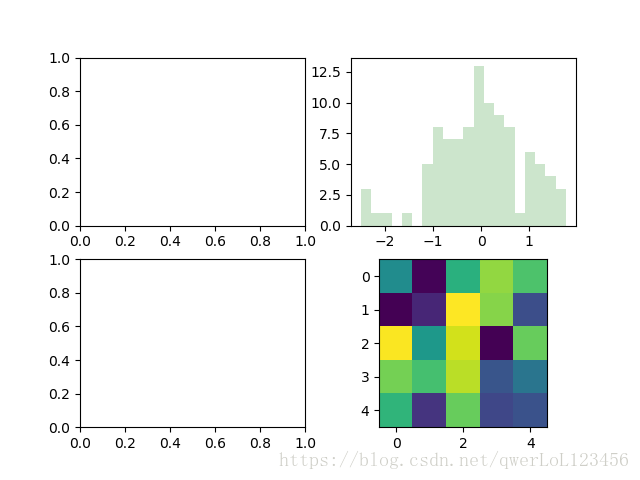
(0)plt.subplots()
同时返回新创建的figure和subplot对象列表 在jupyter里可以正常显示,推荐使用这种方式创建多个图表
生成2行2列subplot:
fig, subplot_arr = plt.subplots(2,2)
print(type(subplot_arr))
范例:
fig, subplot_arr = plt.subplots(2, 2)
print(type(subplot_arr))
subplot_arr[0, 1].hist(np.random.randn(100), bins=20, color='g', alpha=0.2)
subplot_arr[1, 1].imshow(np.random.rand(5, 5))
plt.show()
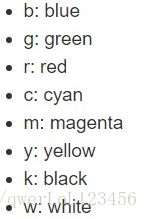
(1)颜色
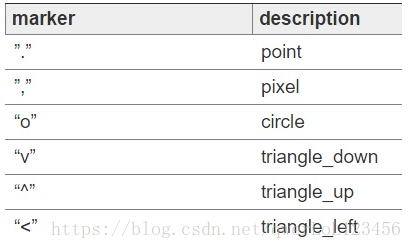
(2)标记
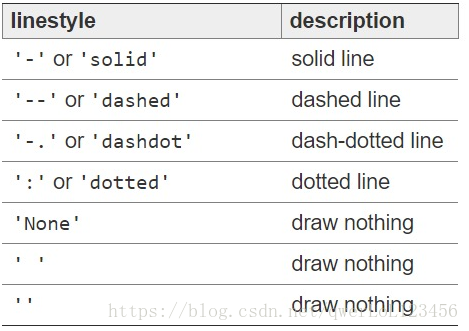
(3)线型
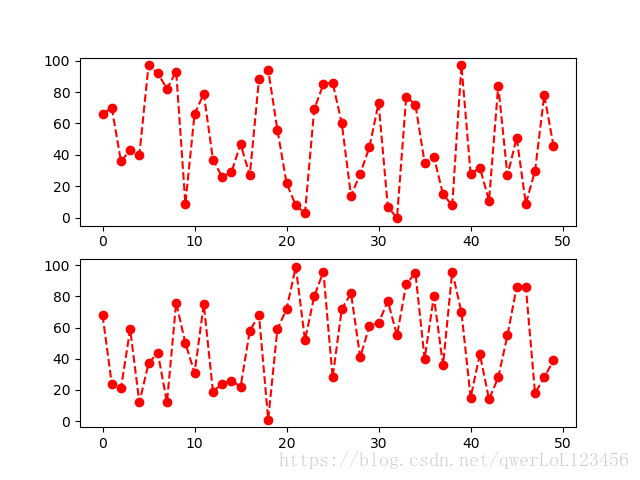
案例:
# 颜色、标记、线型
fig, axes = plt.subplots(2)
axes[0].plot(np.random.randint(0, 100, 50), 'ro--')
# 等价
axes[1].plot(np.random.randint(0, 100, 50), color='r', linestyle='dashed', marker='o')
plt.show()
(4)设置刻度范围
设置刻度范围
plt.xlim([xmin,xmax]),
plt.ylim([ymin,ymax])
ax.set_xlim(),
ax.set_ylim()
设置显示的刻度
plt.xticks(list), plt.yticks(list)
ax.set_xticks(list), ax.set_yticks(list)
(5)设置刻度标签
设置刻度标签
ax.set_xticklabels()
ax.set_yticklabels()
设置坐标轴标签
ax.set_xlabel(list), ax.set_ylabel(list)
设置标题
ax.set_title()
(6)图例
ax.plot(label= 'legend')
ax.legend()
plt.legend()
loc='best':自动选择放置图例最佳位置
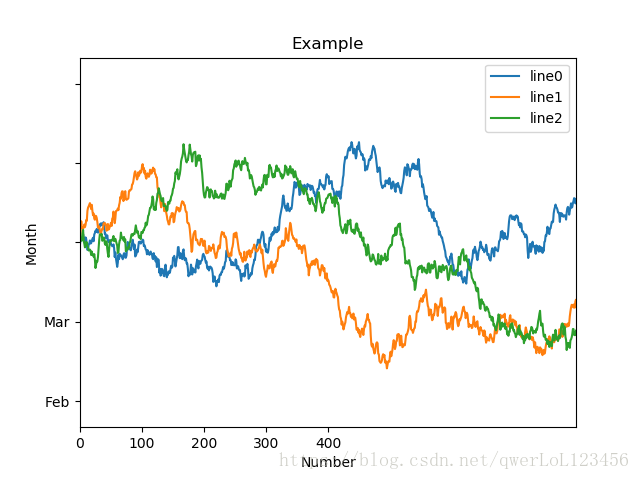
范例:
fig, ax = plt.subplots(1)
ax.plot(np.random.randn(1000).cumsum(), label='line0')
# 设置刻度
# plt.xlim([0,500])
ax.set_xlim([0, 800])
# 设置显示的x刻度
# plt.xticks([0,500])
ax.set_xticks(range(0,500,100))
# 设置y刻度标签
ax.set_yticklabels(['Jan', 'Feb', 'Mar'])
# 设置坐标轴标签
ax.set_xlabel('Number')
ax.set_ylabel('Month')
# 设置标题
ax.set_title('Example')
# 图例
ax.plot(np.random.randn(1000).cumsum(), label='line1')
ax.plot(np.random.randn(1000).cumsum(), label='line2')
ax.legend()
ax.legend(loc='best')
plt.show()


 8万+
8万+

 被折叠的 条评论
为什么被折叠?
被折叠的 条评论
为什么被折叠?
 到【灌水乐园】发言


