


library(ggplot2)
changetoM <- function(position)
{
position=position/1000000;
paste(position, "M", sep="")
}
data <- read.table("test.anchors", head=TRUE)
head(data)
ChrA <- c("Chr1A", "Chr2A", "Chr3A", "Chr4A", "Chr5A", "Chr6A", "Chr7A", "Chr8A", "Chr9A", "Chr10A")
ChrB <- c("Chr1B", "Chr2B", "Chr3B", "Chr4B", "Chr5B", "Chr6B", "Chr7B", "Chr8B", "Chr9B", "Chr10B")
data = data[which(data$refChr %in% ChrA),]
data = data[which(data$queryChr %in% ChrB),]
data$refChr = factor(data$refChr, levels=ChrA)
data$queryChr = factor(data$queryChr, levels=ChrB)
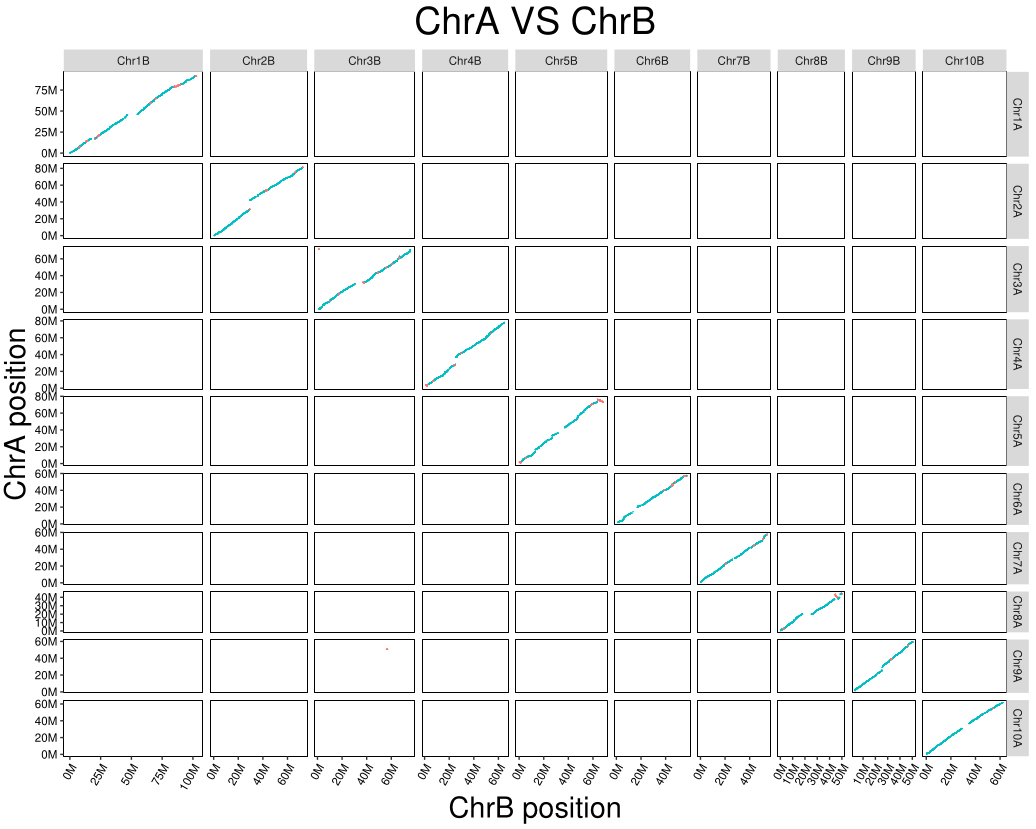
P <- ggplot(data = data, aes(x = queryStart, y = referenceStart)) +
# 调整共线性点的大小
geom_point(size = 1, aes(color = strand)) +
facet_grid(refChr ~ queryChr, scales = "free", space = "free") +
theme_grey(base_size = 100) +
labs(
title = "ChrA VS ChrB",
x = "ChrB position", y = "ChrA position"
) +
theme(plot.title = element_text(size = 260, hjust = 0.5),
axis.title.x = element_text(size = 200),
axis.title.y = element_text(size = 200)) +
scale_x_continuous(labels=changetoM) +
scale_y_continuous(labels=changetoM) +
theme(axis.line = element_blank(),
panel.background = element_blank(),
panel.border = element_rect(fill=NA,color="black", linewidth=0.5, linetype="solid"),
axis.text.y = element_text( colour = "black",),
legend.position='none',
axis.text.x = element_text(angle=60, hjust=1, vjust=1, colour = "black"))
# print(P)
ggsave("ChrA_VS_ChrB.pdf", P, width = 100, height = 80, limitsize = FALSE)
测试文件:https://share.feijipan.com/s/WTAv1DoJ
更多 生物信息学 分享,请关注微信公众号:Life 生命
持续更新中。。。

本文由 mdnice 多平台发布


 被折叠的 条评论
为什么被折叠?
被折叠的 条评论
为什么被折叠?
 到【灌水乐园】发言


