


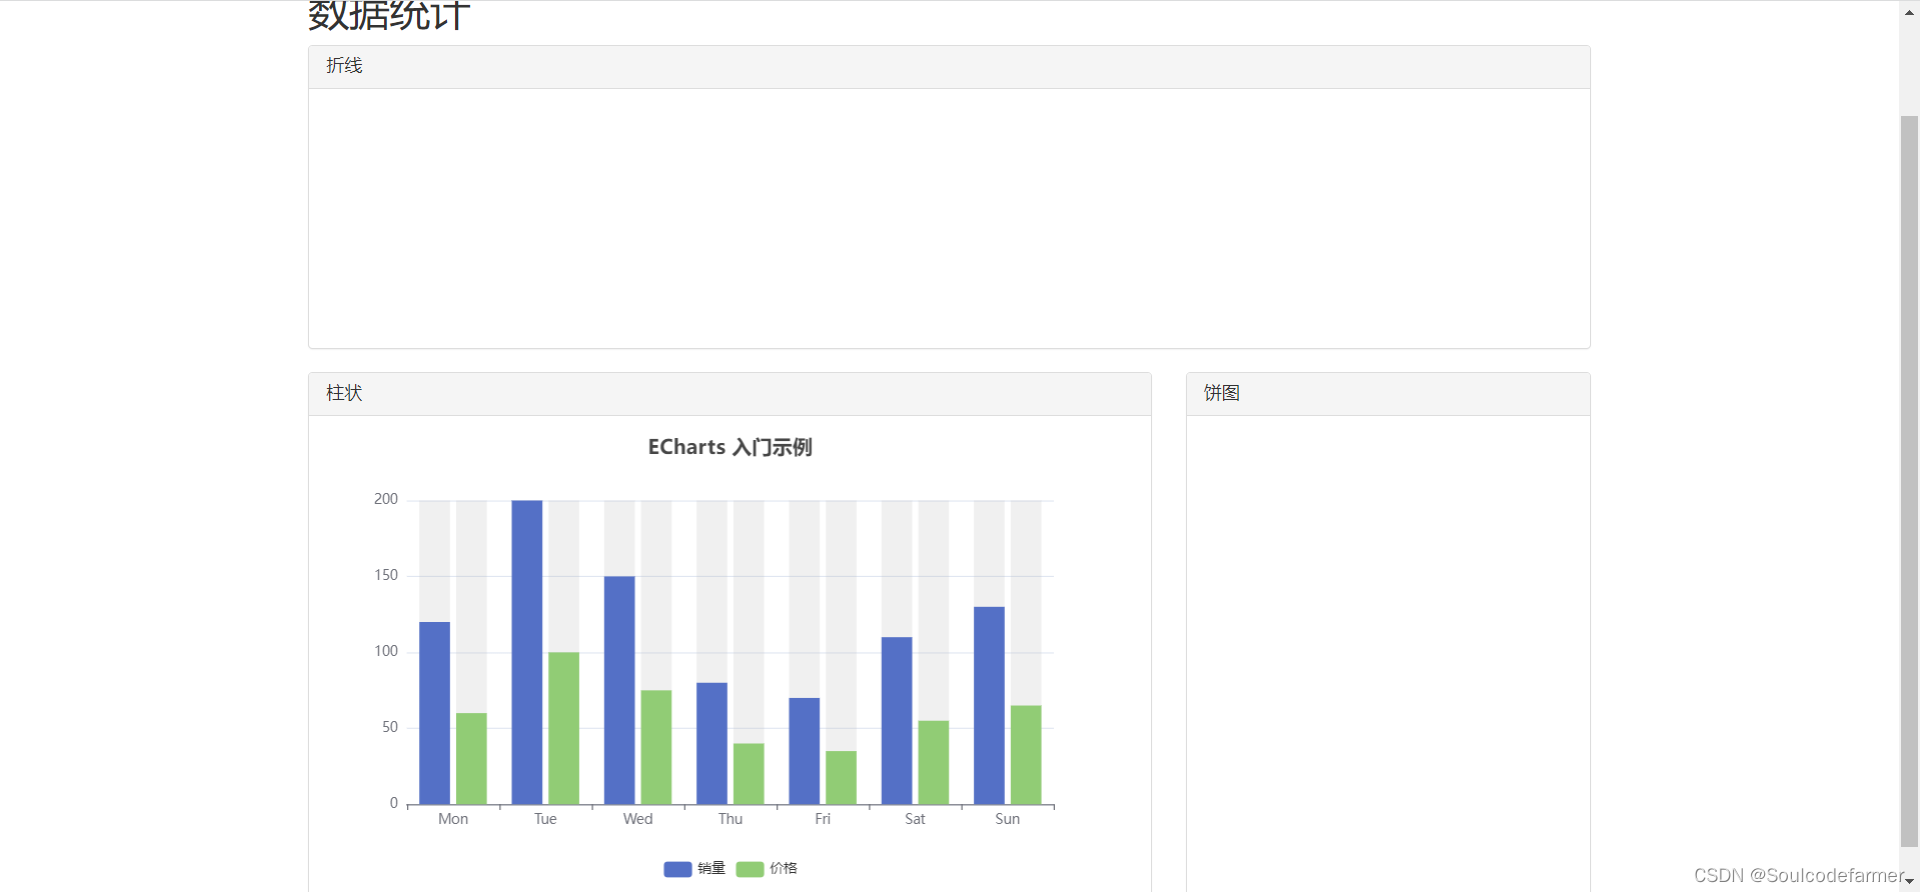
数据统计
echarts使用
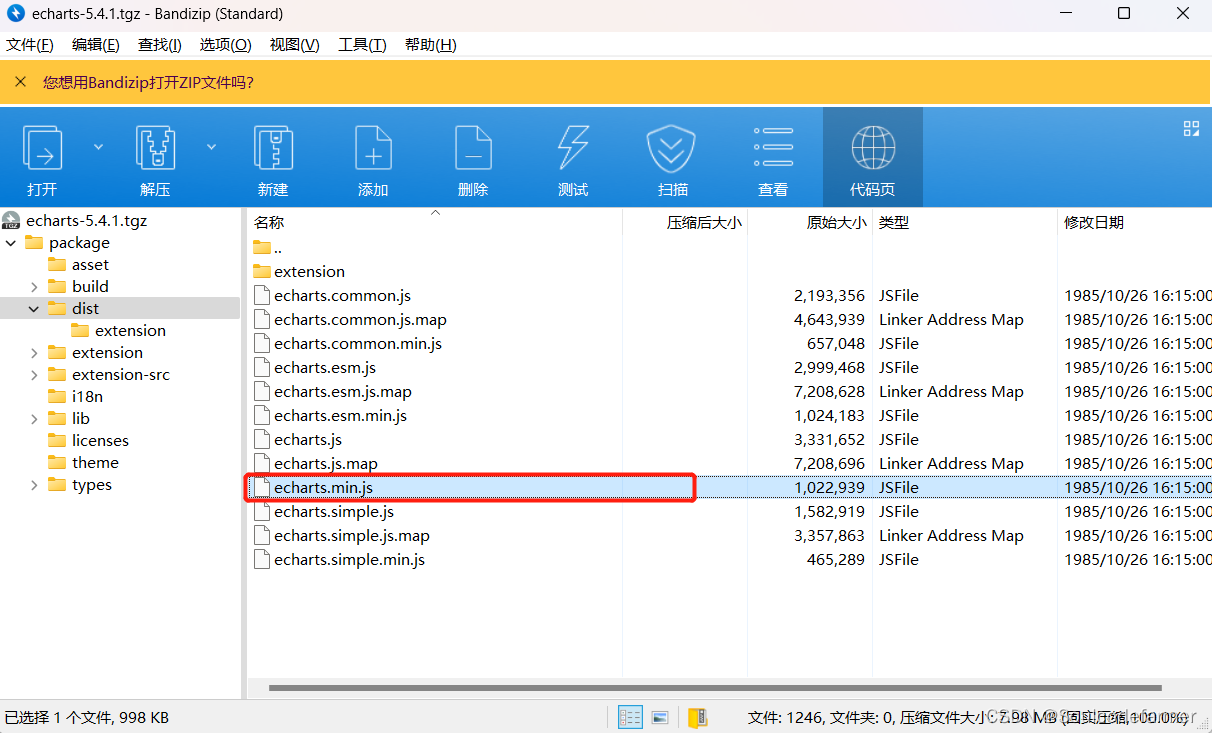
导入文件
下载文件
https://registry.npmjs.org/echarts/-/echarts-5.4.1.tgz
使用官网案例图
https://echarts.apache.org/examples/zh/index.html#chart-type-pie
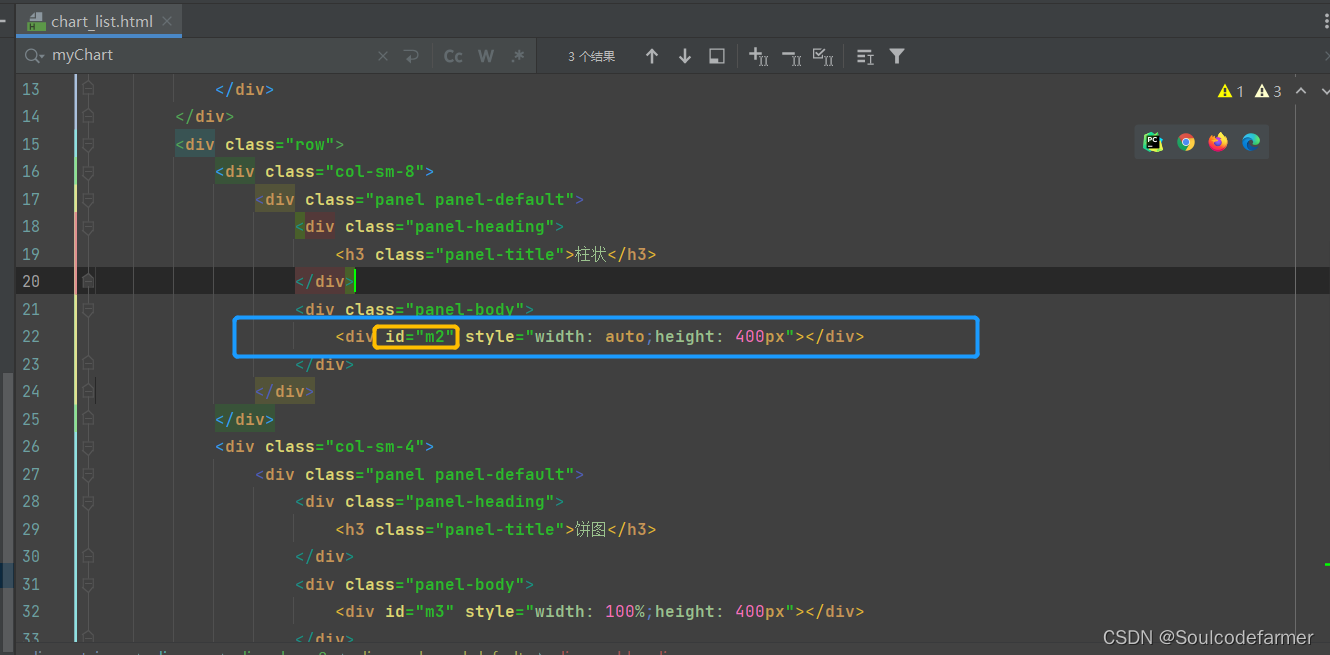
写一个div得设置长宽
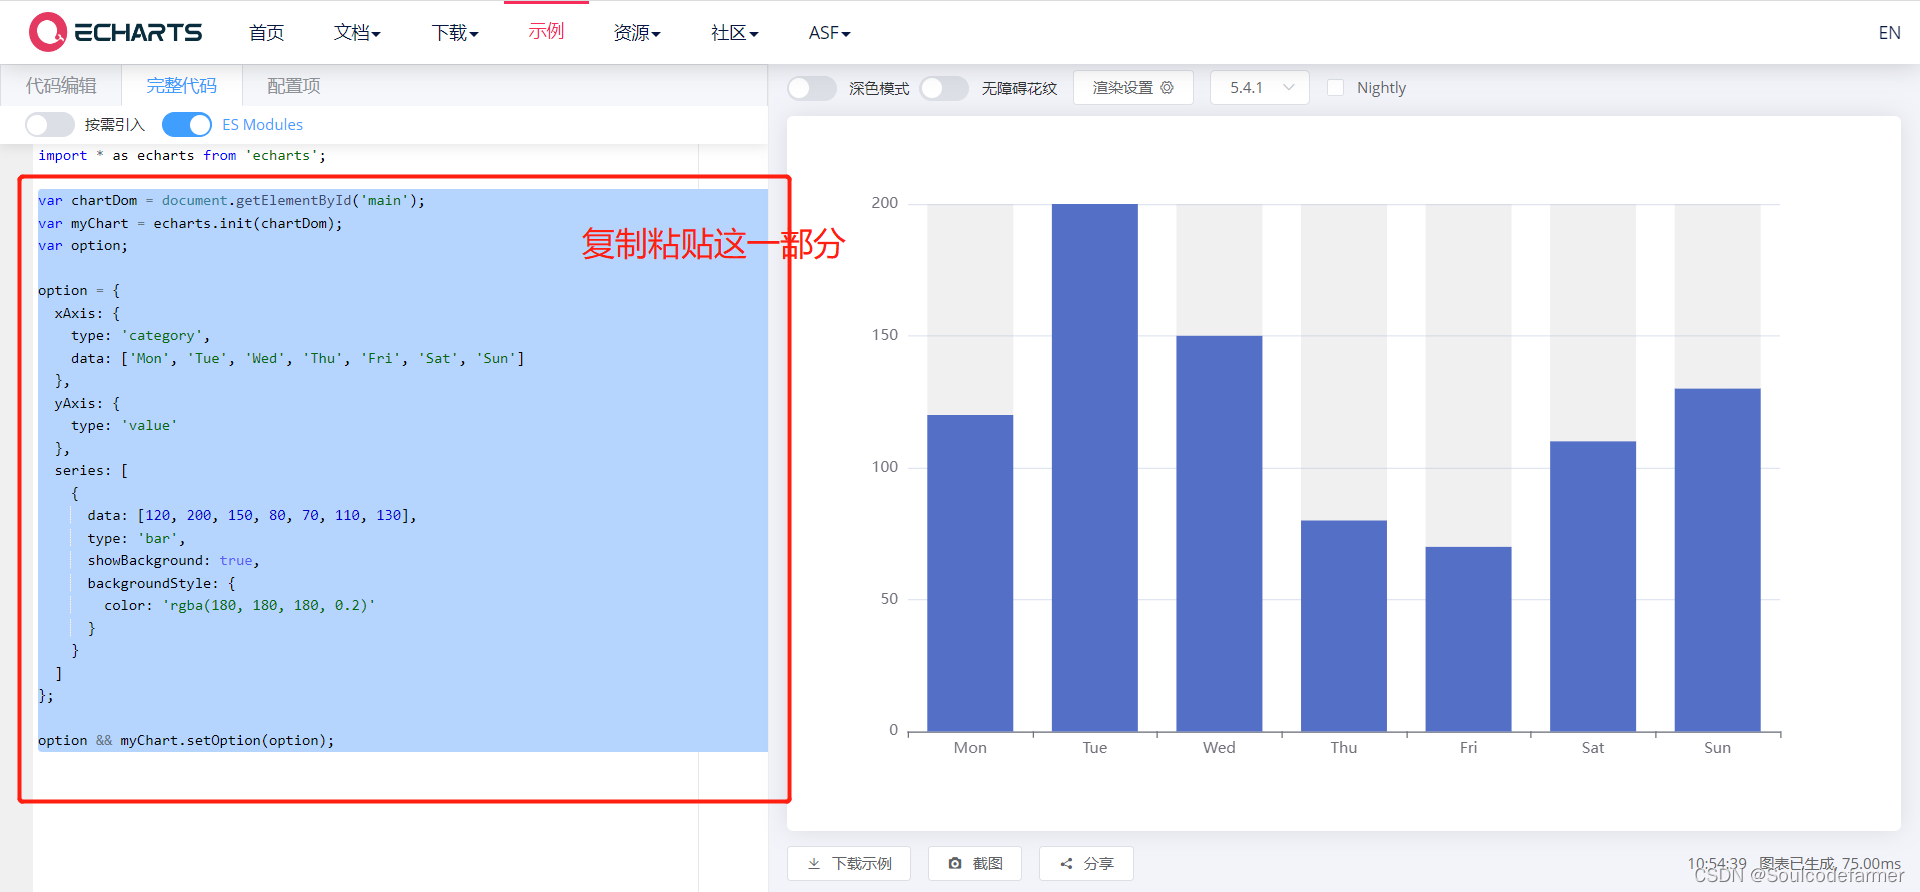 写到js里面,简单修改
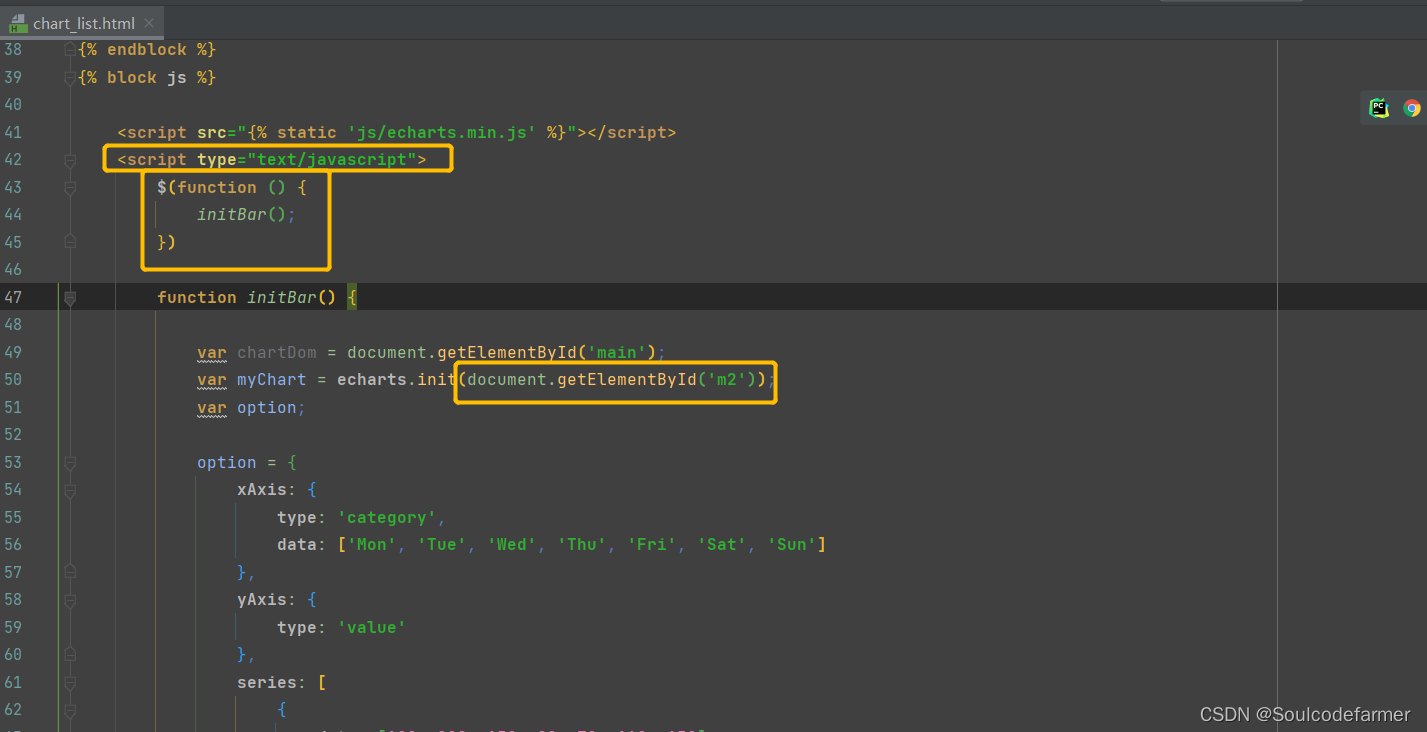
按id找到div
document.getElementById(“m2”)
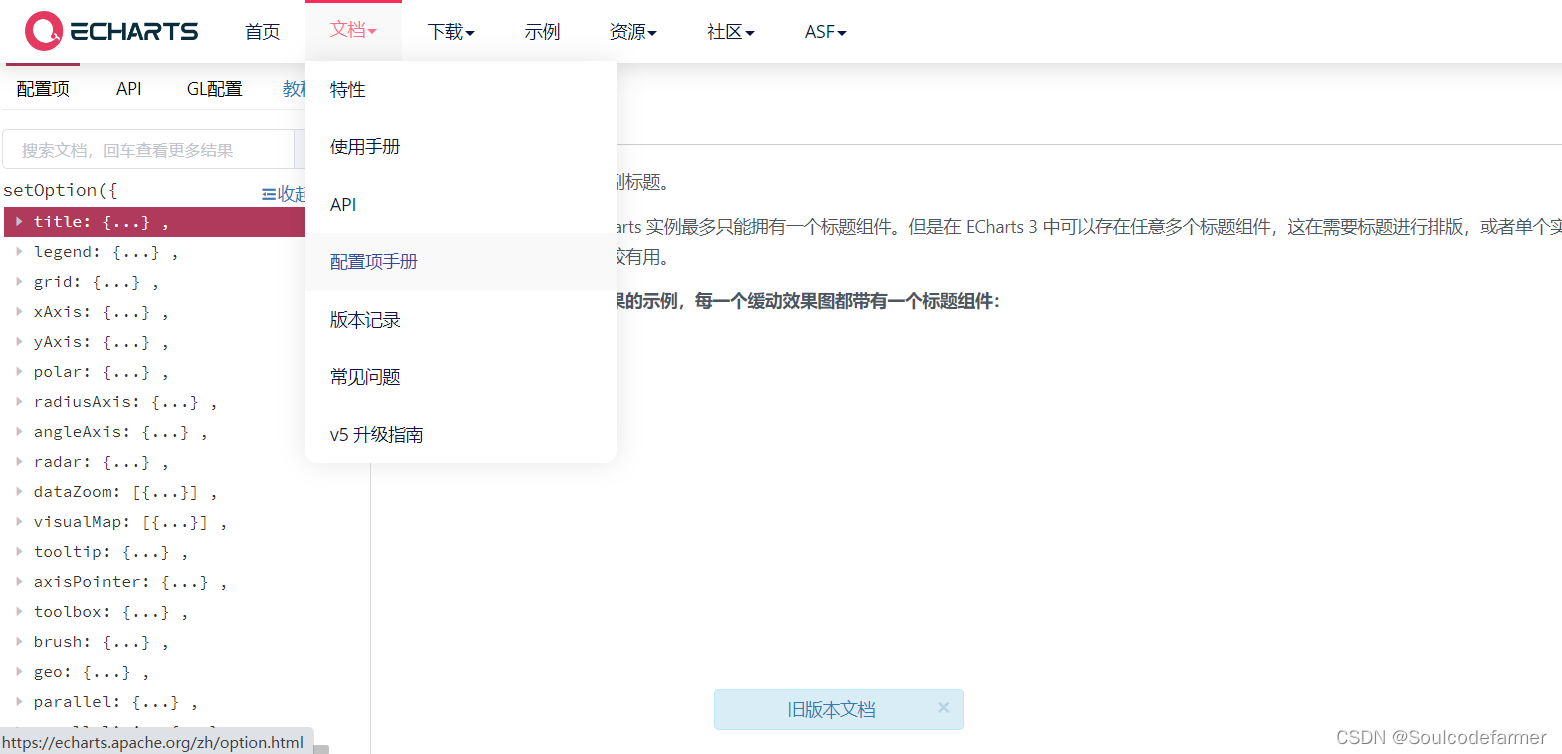
修改图样式
官方文档说明https://echarts.apache.org/zh/option.html
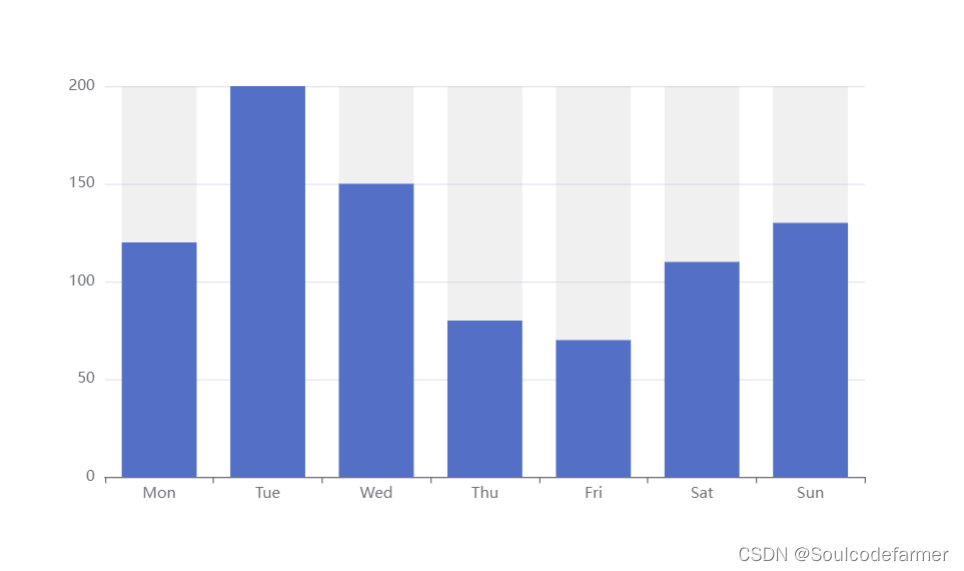
原来数据样式
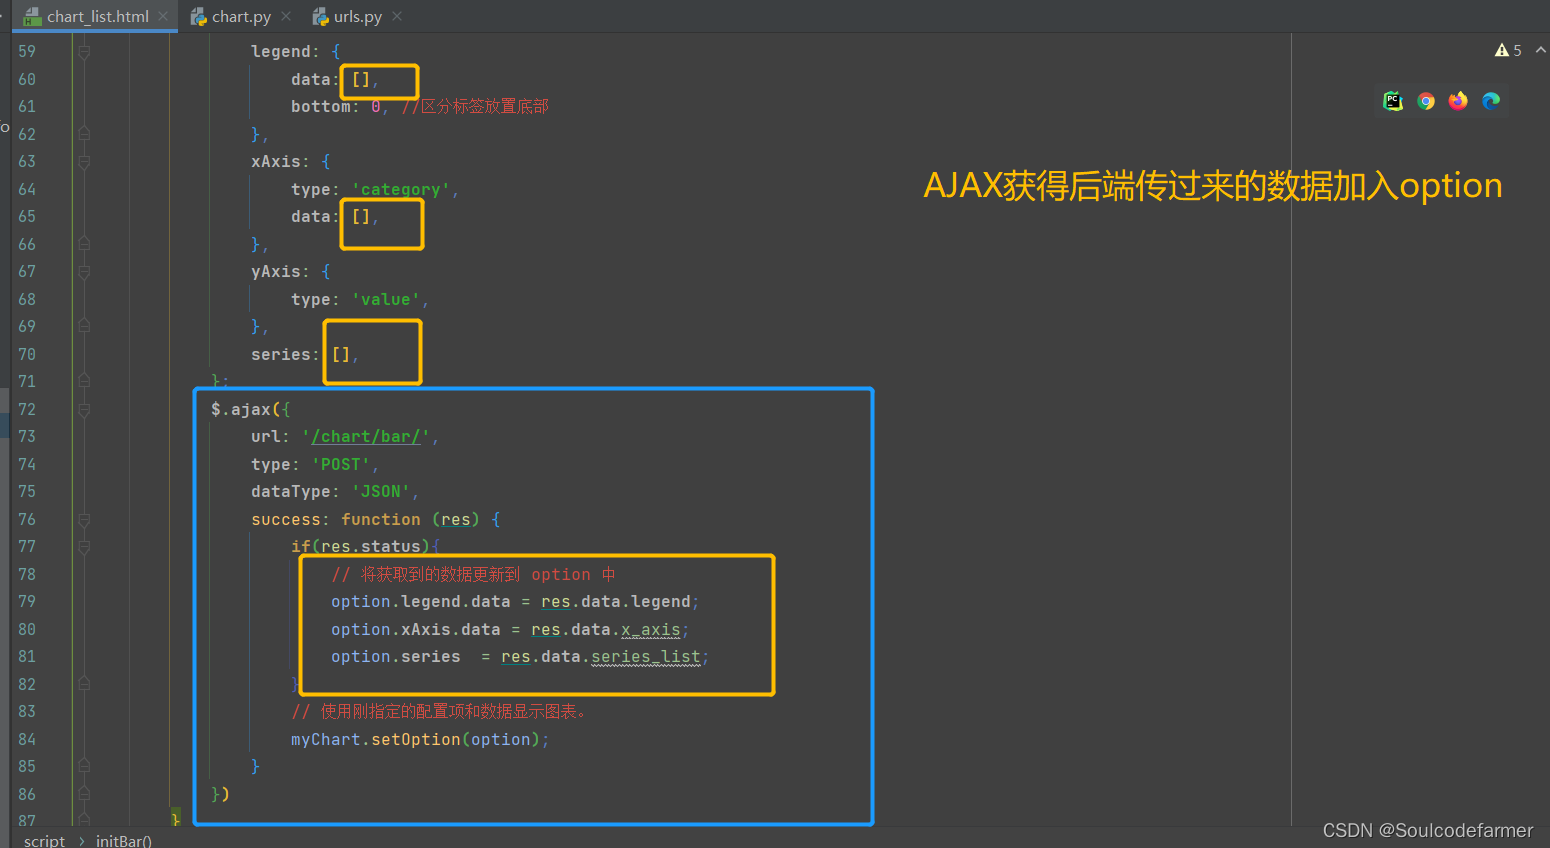
ajax请求后台获取数据
 myChart.setOption(option);必须放到成功的function(res){}里面
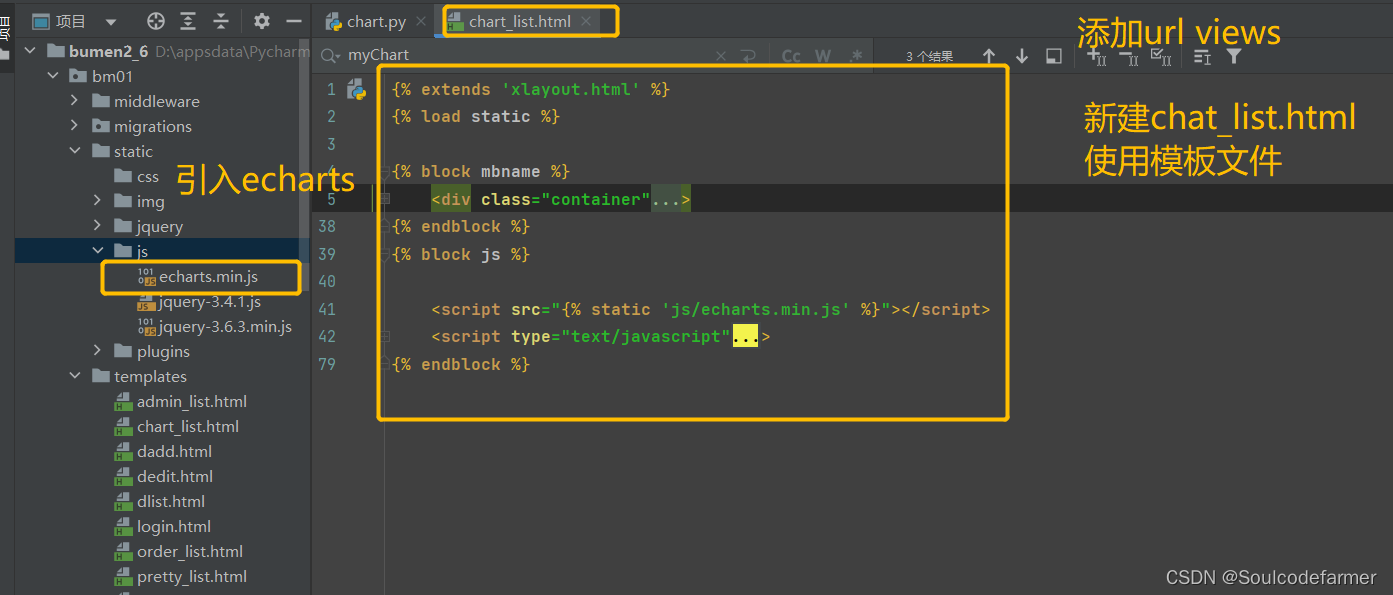
chart_list.html
{% extends 'xlayout.html' %}
{% load static %}
{% block mbname %}
<div class="container">
<h1>数据统计</h1>
<div class="panel panel-default">
<div class="panel-heading">
<h3 class="panel-title">折线</h3>
</div>
<div class="panel-body">
<div id="m1" style="width: 100%;height: 200px"></div>
</div>
</div>
<div class="row">
<div class="col-sm-8">
<div class="panel panel-default">
<div class="panel-heading">
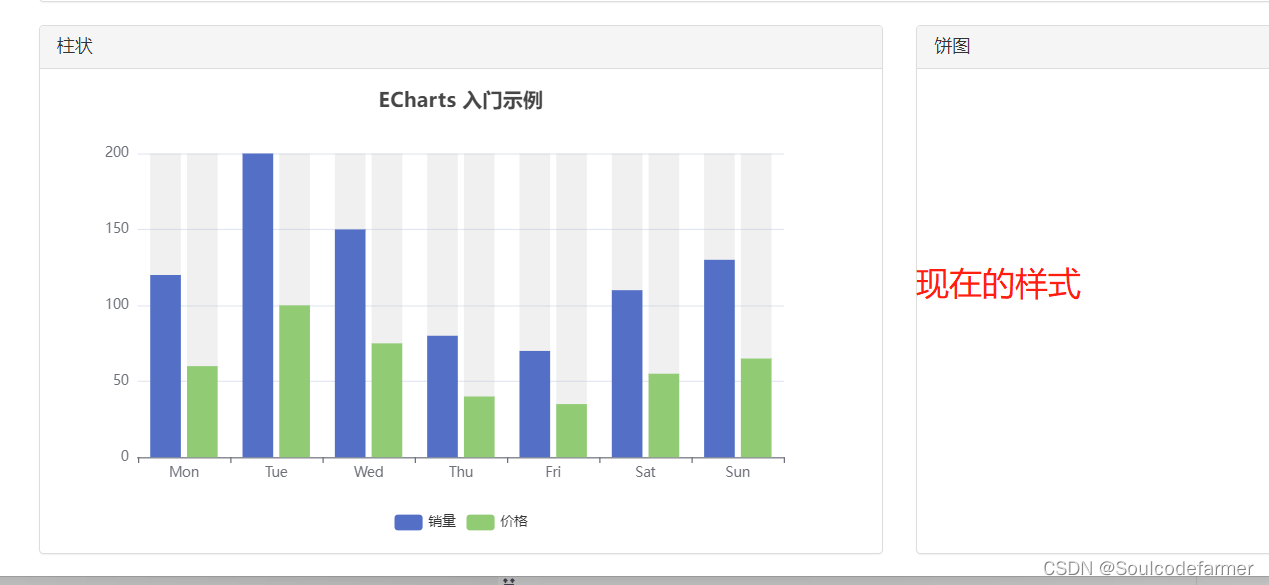
<h3 class="panel-title">柱状</h3>
</div>
<div class="panel-body">
<div id="m2" style="width: auto;height: 400px"></div>
</div>
</div>
</div>
<div class="col-sm-4">
<div class="panel panel-default">
<div class="panel-heading">
<h3 class="panel-title">饼图</h3>
</div>
<div class="panel-body">
<div id="m3" style="width: 100%;height: 400px"></div>
</div>
</div>
</div>
</div>
</div>
{% endblock %}
{% block js %}
<script src="{% static 'js/echarts.min.js' %}"></script>
<script type="text/javascript">
$(function () {
initBar();
})
function initBar() {
// 基于准备好的dom,初始化echarts实例
var chartDom = document.getElementById('m2');
var myChart = echarts.init(chartDom);
var option;
// 指定图表的配置项和数据
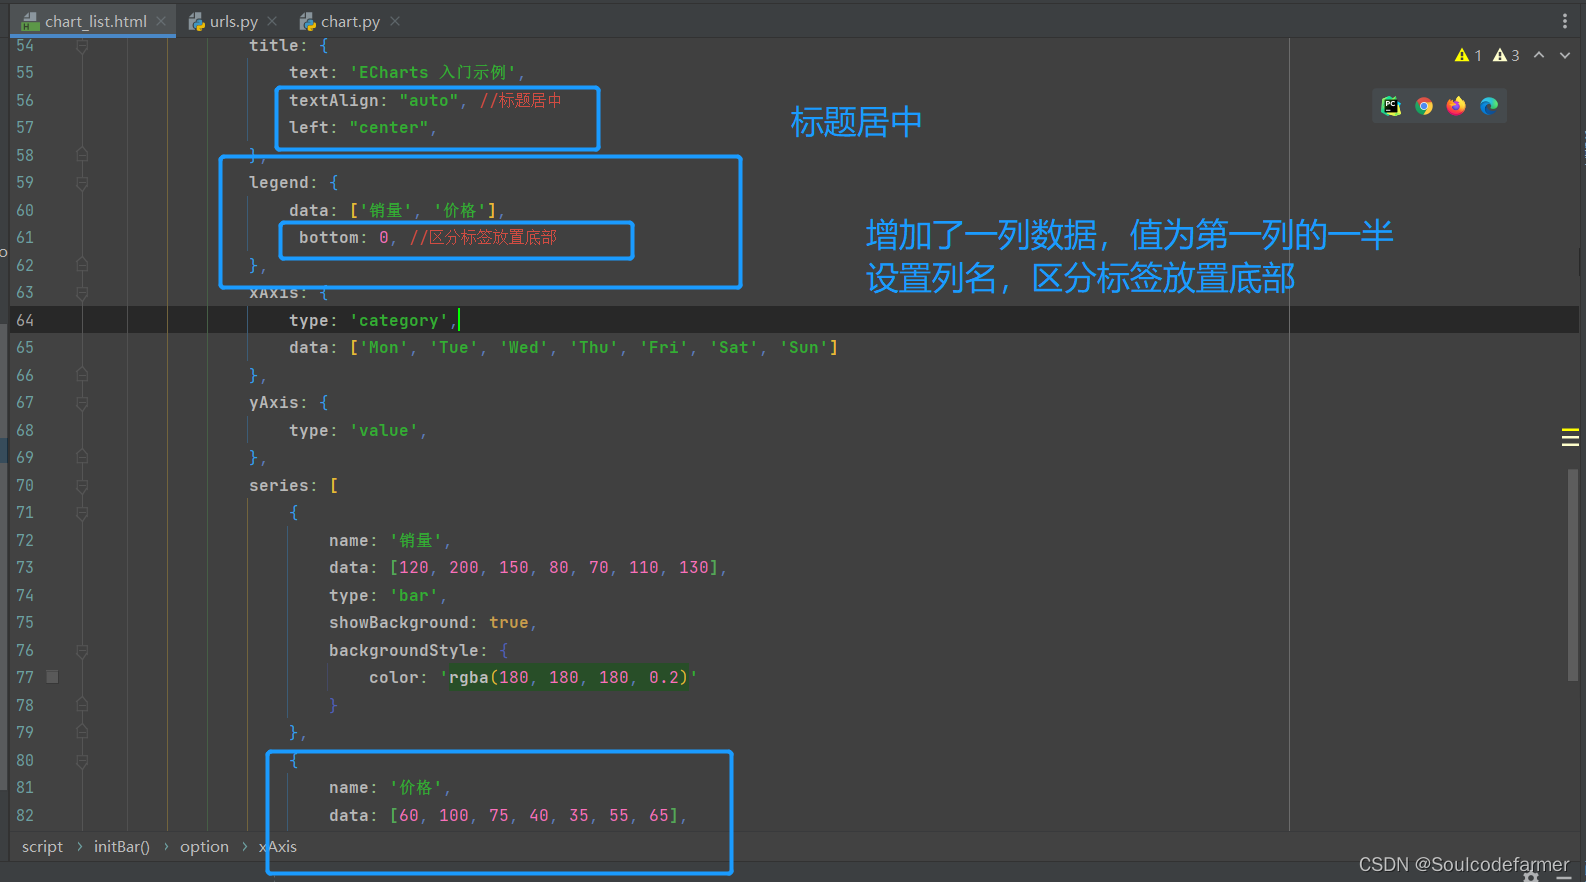
option = {
title: {
text: 'ECharts 入门示例',
textAlign: "auto", //标题居中
left: "center",
},
legend: {
data: [],
bottom: 0, //区分标签放置底部
},
xAxis: {
type: 'category',
data: [],
},
yAxis: {
type: 'value',
},
series: [],
};
$.ajax({
url: '/chart/bar/',
type: 'POST',
dataType: 'JSON',
success: function (res) {
if(res.status){
// 将获取到的数据更新到 option 中
option.legend.data = res.data.legend;
option.xAxis.data = res.data.x_axis;
option.series = res.data.series_list;
}
// 使用刚指定的配置项和数据显示图表。
myChart.setOption(option);
}
})
}
</script>
{% endblock %}
。py
# author : Sun; time : 2023/2/17 12:57;
from django.http import JsonResponse
from django.shortcuts import render, HttpResponse
from django.views.decorators.csrf import csrf_exempt
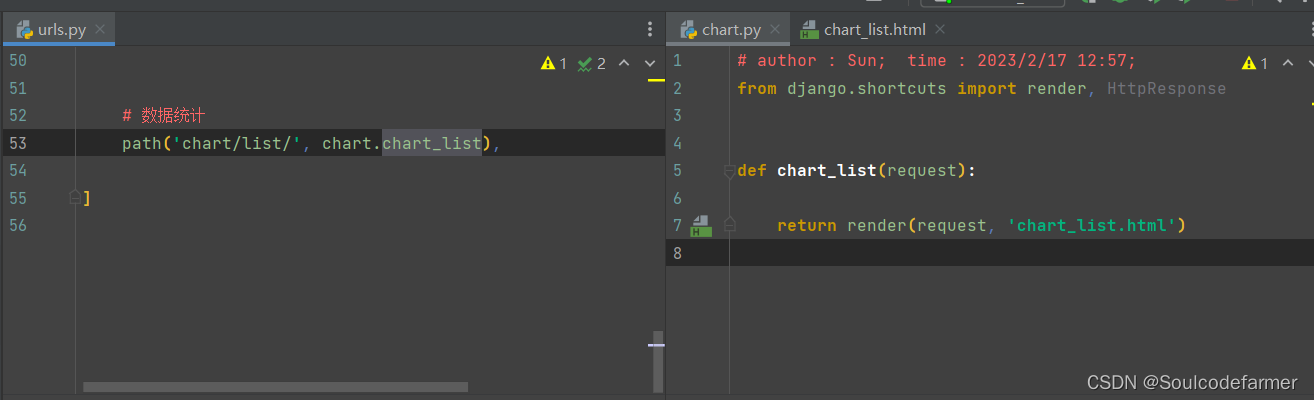
def chart_list(request):
return render(request, 'chart_list.html')
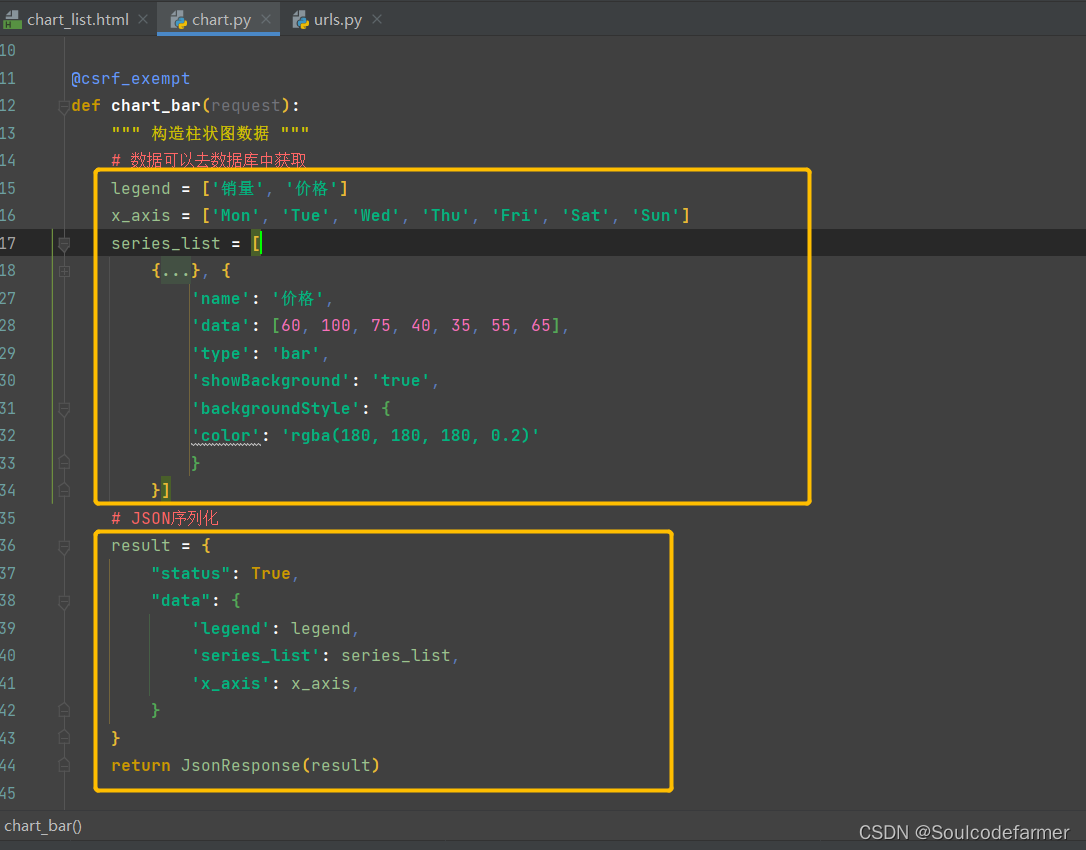
@csrf_exempt
def chart_bar(request):
""" 构造柱状图数据 """
# 数据可以去数据库中获取
legend = ['销量', '价格']
x_axis = ['Mon', 'Tue', 'Wed', 'Thu', 'Fri', 'Sat', 'Sun']
series_list = [
{
'name': '销量',
'data': [120, 200, 150, 80, 70, 110, 130],
'type': 'bar',
'showBackground': 'true',
'backgroundStyle': {
'color': 'rgba(180, 180, 180, 0.2)'
}
}, {
'name': '价格',
'data': [60, 100, 75, 40, 35, 55, 65],
'type': 'bar',
'showBackground': 'true',
'backgroundStyle': {
'color': 'rgba(180, 180, 180, 0.2)'
}
}]
# JSON序列化
result = {
"status": True,
"data": {
'legend': legend,
'series_list': series_list,
'x_axis': x_axis,
}
}
return JsonResponse(result)
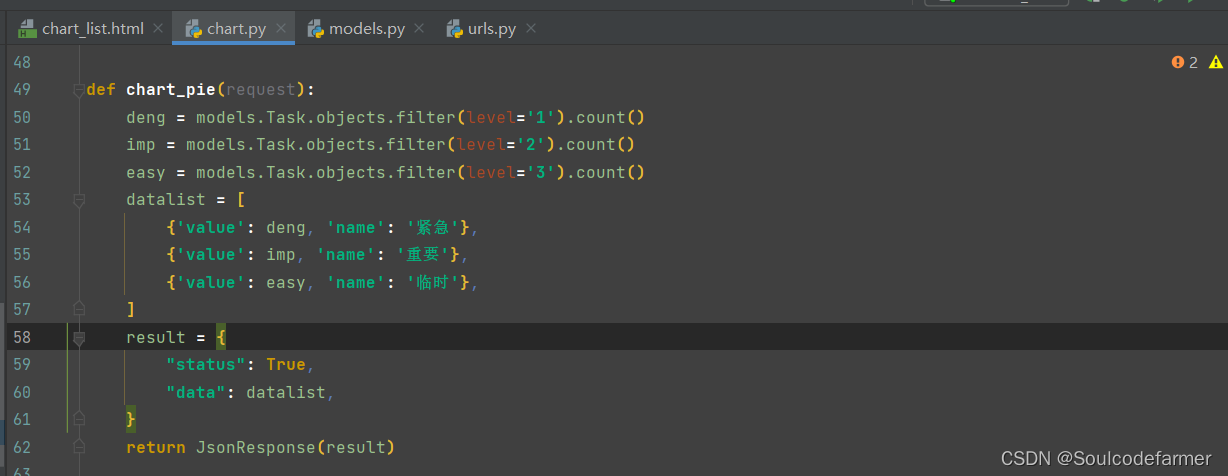
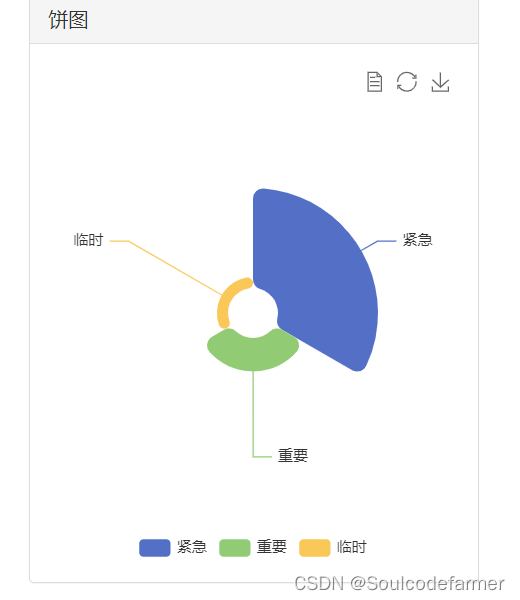
饼图
数据库获取信息
其他同上
多图代码
# author : Sun;  time : 2023/2/17 12:57;
from django.http import JsonResponse
from django.shortcuts import render, HttpResponse
from django.views.decorators.csrf import csrf_exempt

from bm01 import models


def chart_list(request):
    return render(request, 'chart_list.html')


@csrf_exempt
def chart_bar(request):
    """ 构造柱状图数据 """
    # 数据可以去数据库中获取
    legend = ['销量', '价格']
    x_axis = ['Mon', 'Tue', 'Wed', 'Thu', 'Fri', 'Sat', 'Sun']
    series_list = [
        {
            'name': '销量',
            'data': [120, 200, 150, 80, 70, 110, 130],
            'type': 'bar',
            'showBackground': 'true',
            'backgroundStyle': {
                'color': 'rgba(180, 180, 180, 0.2)'
            }
        }, {
            'name': '价格',
            'data': [60, 100, 75, 40, 35, 55, 65],
            'type': 'bar',
            'showBackground': 'true',
            'backgroundStyle': {
                'color': 'rgba(180, 180, 180, 0.2)'
            }
        }]
    # JSON序列化
    result = {
        "status": True,
        "data": {
            'legend': legend,
            'series_list': series_list,
            'x_axis': x_axis,
        }
    }
    return JsonResponse(result)


def chart_pie(request):
    deng = models.Task.objects.filter(level='1').count()
    imp = models.Task.objects.filter(level='2').count()
    easy = models.Task.objects.filter(level='3').count()
    datalist = [
        {'value': deng, 'name': '紧急'},
        {'value': imp, 'name': '重要'},
        {'value': easy, 'name': '临时'},
    ]
    result = {
        "status": True,
        "data": datalist,
    }
    return JsonResponse(result)
url.py
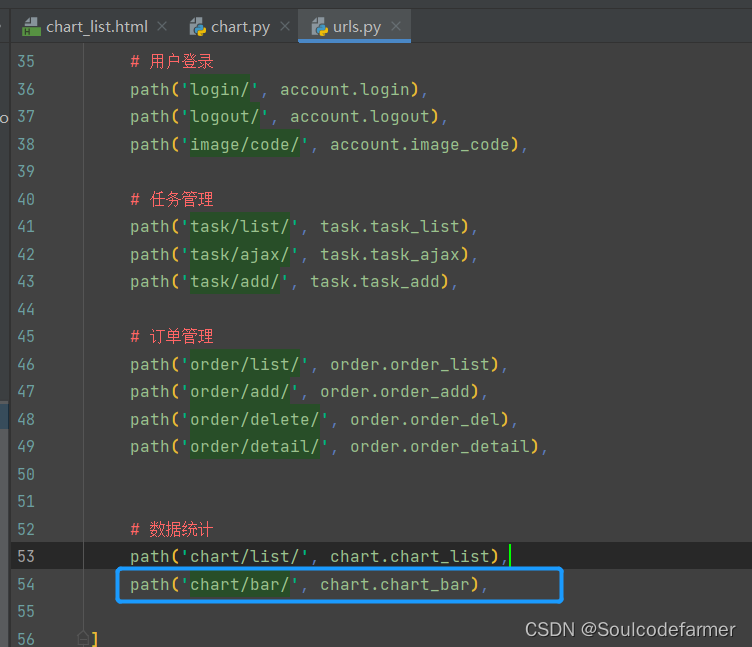
    # 数据统计
    path('chart/list/', chart.chart_list),
    path('chart/bar/', chart.chart_bar),
    path('chart/pie/', chart.chart_pie),
echart_list.html
{% extends 'xlayout.html' %}
{% load static %}

{% block mbname %}
    <div class="container">
        <h1>数据统计</h1>
        <div class="panel panel-default">
            <div class="panel-heading">
                <h3 class="panel-title">折线</h3>
            </div>
            <div class="panel-body col-sm-12">
                <div id="m1" style="width: 100%;height: 300px"></div>
            </div>
        </div>
        <div class="row">
            <div class="col-sm-8">
                <div class="panel panel-default">
                    <div class="panel-heading">
                        <h3 class="panel-title">柱状</h3>
                    </div>
                    <div class="panel-body">
                        <div id="m2" style="width: auto;height: 400px"></div>
                    </div>
                </div>
            </div>
            <div class="col-sm-4">
                <div class="panel panel-default">
                    <div class="panel-heading">
                        <h3 class="panel-title">饼图</h3>
                    </div>
                    <div class="panel-body">
                        <div id="m3" style="width: 100%;height: 400px"></div>
                    </div>
                </div>
            </div>
        </div>
    </div>
{% endblock %}
{% block js %}

    <script src="{% static 'js/echarts.min.js' %}"></script>
    <script type="text/javascript">
        $(function () {
            initBar();
            initPie();
            initLine();
        })

        function initBar() {
            // 基于准备好的dom,初始化echarts实例
            var chartDom = document.getElementById('m2');
            var myChart = echarts.init(chartDom);
            var option;
            // 指定图表的配置项和数据
            option = {
                title: {
                    text: '德玛西亚',
                    textAlign: "auto", //标题居中
                    left: "center",
                },
                legend: {
                    data: [],
                    bottom: 0, //区分标签放置底部
                },
                xAxis: {
                    type: 'category',
                    data: [],
                },
                yAxis: {
                    type: 'value',
                },
                series: [],
            };
            $.ajax({
                url: '/chart/bar/',
                type: 'POST',
                dataType: 'JSON',
                success: function (res) {
                    if (res.status) {
                        // 将获取到的数据更新到 option 中
                        option.legend.data = res.data.legend;
                        option.xAxis.data = res.data.x_axis;
                        option.series = res.data.series_list;
                        {#myChart.setOption(option);#}
                    }
                    // 使用刚指定的配置项和数据显示图表。
                    myChart.setOption(option);
                }

            })


        }

        function initPie() {

            var chartDom = document.getElementById('m3');
            var myChart = echarts.init(chartDom);
            var option;

            option = {
                legend: {
                    top: 'bottom'
                },
                toolbox: {
                    show: true,
                    feature: {
                        mark: {show: true},
                        dataView: {show: true, readOnly: false},
                        restore: {show: true},
                        saveAsImage: {show: true}
                    }
                },
                series: [
                    {
                        name: 'Nightingale Chart',
                        type: 'pie',
                        radius: [20, 100],
                        center: ['50%', '50%'],
                        roseType: 'area',
                        itemStyle: {
                            borderRadius: 8
                        },
                        data: []
                    }
                ]
            };
            $.ajax({
                url: '/chart/pie/',
                dataType: "json",
                type: "GET",
                success: function (res) {
                    option.series[0].data = res.data;
                    option && myChart.setOption(option);
                }
            })


        }

        function initLine() {

            var chartDom = document.getElementById('m1');
            var myChart = echarts.init(chartDom);
            var option;

            option = {
                title: {
                    text: 'Stacked Area Chart'
                },
                tooltip: {
                    trigger: 'axis',
                    axisPointer: {
                        type: 'cross',
                        label: {
                            backgroundColor: '#6a7985'
                        }
                    }
                },
                legend: {
                    data: ['Email', 'Union Ads', 'Video Ads', 'Direct', 'Search Engine']
                },
                toolbox: {
                    feature: {
                        saveAsImage: {}
                    }
                },
                grid: {
                    left: '3%',
                    right: '4%',
                    bottom: '3%',
                    containLabel: true
                },
                xAxis: [
                    {
                        type: 'category',
                        boundaryGap: false,
                        data: ['Mon', 'Tue', 'Wed', 'Thu', 'Fri', 'Sat', 'Sun']
                    }
                ],
                yAxis: [
                    {
                        type: 'value'
                    }
                ],
                series: [
                    {
                        name: 'Email',
                        type: 'line',
                        stack: 'Total',
                        areaStyle: {},
                        emphasis: {
                            focus: 'series'
                        },
                        data: [120, 132, 101, 134, 90, 230, 210]
                    },
                    {
                        name: 'Union Ads',
                        type: 'line',
                        stack: 'Total',
                        areaStyle: {},
                        emphasis: {
                            focus: 'series'
                        },
                        data: [220, 182, 191, 234, 290, 330, 310]
                    },
                    {
                        name: 'Video Ads',
                        type: 'line',
                        stack: 'Total',
                        areaStyle: {},
                        emphasis: {
                            focus: 'series'
                        },
                        data: [150, 232, 201, 154, 190, 330, 410]
                    },
                    {
                        name: 'Direct',
                        type: 'line',
                        stack: 'Total',
                        areaStyle: {},
                        emphasis: {
                            focus: 'series'
                        },
                        data: [320, 332, 301, 334, 390, 330, 320]
                    },
                    {
                        name: 'Search Engine',
                        type: 'line',
                        stack: 'Total',
                        label: {
                            show: true,
                            position: 'top'
                        },
                        areaStyle: {},
                        emphasis: {
                            focus: 'series'
                        },
                        data: [820, 932, 901, 934, 1290, 1330, 1320]
                    }
                ]
            };

            option && myChart.setOption(option);

        }
    </script>
{% endblock %}


 3914
3914


 被折叠的 条评论
为什么被折叠?
被折叠的 条评论
为什么被折叠?
 到【灌水乐园】发言


