


Mandelbrot分形:
Mandelbrot[zc_] := Module[{z = 0, i = 0}, While[i < 100 && Abs[z] < 2, z = z^2 + zc; i++]; i];
DensityPlot[Mandelbrot[xc + I yc], {xc, -2, 1}, {yc, -1.5, 1.5}, PlotPoints -> 275,
Mesh -> False, Frame -> False, ColorFunction -> (If[# ≠ 1,
Hue[#], Hue[0, 0, 0]] &)]; 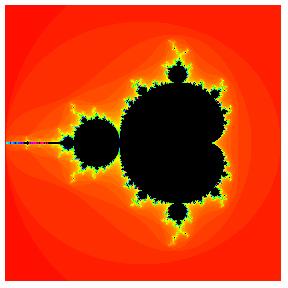
Spirals:
Show[Graphics[RasterArray[Table[r1 = (x - 1)^2 + y^2; r2 = (x +
1)^2 + y^2; Hue[(Sign[y]ArcCos[(x^2 + y^2 -
1)/Sqrt[r1 r2]] - Log[r1/r2])/(2Pi)], {x, -2, 2, 4/
274}, {y, -2, 2, 4/274}]], AspectRatio -> 1]];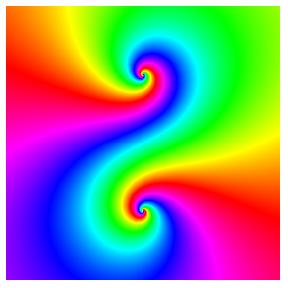
DLA:
n = 100; ix = iy = n/2;
 最低0.47元/天 解锁文章


 2968
2968


 被折叠的 条评论
为什么被折叠?
被折叠的 条评论
为什么被折叠?
 到【灌水乐园】发言


