


对于一些原理图的绘制,可以使用Tikz包,但是通过代码的方式画图可能不方便,可以使用Mathcha网页先在线画图,然后导出为Tikz代码提高效率
画好以后先点击图片显示边框
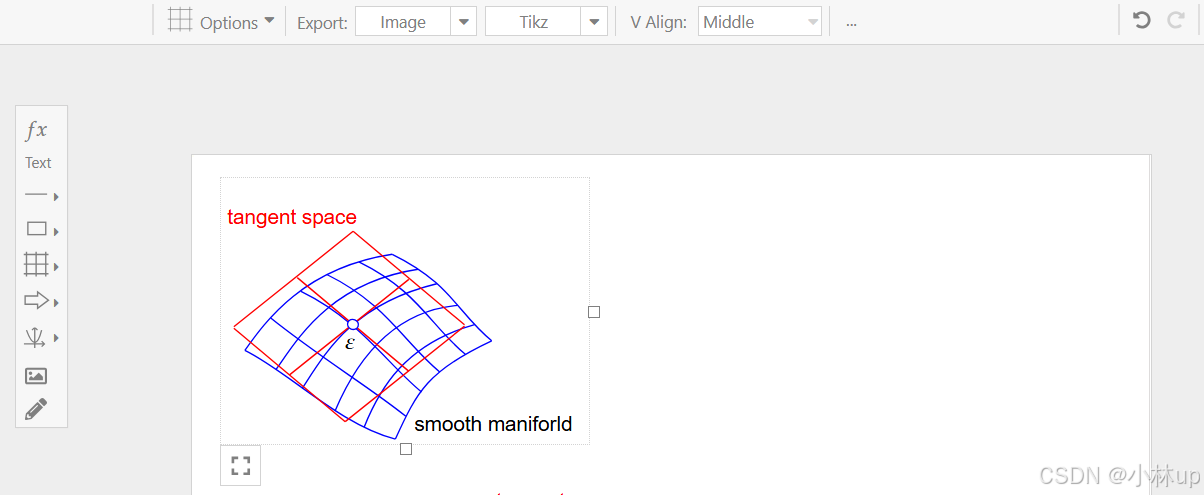
然后点击上方的Copy Tikz to Clipboard
回到我们的LaTex文档,在LaTex前面插入tikz宏包
\usepackage{tikz}
使用在需要的位置插入图片的代码:
\begin{figure}[htbp]
    \centering
    % 复制来的tikz代码
    \caption{this is caption}
    \label{fig}
\end{figure}
例如上面的示例就是:
\begin{figure}[htbp]
\centering
\tikzset{every picture/.style={line width=0.75pt}} %set default line width to 0.75pt
\begin{tikzpicture}[x=0.75pt,y=0.75pt,yscale=-1,xscale=1]
%uncomment if require: \path (0,189); %set diagram left start at 0, and has height of 189
%Curve Lines [id:da7623337276697473]
\draw [color={rgb, 255:red, 0; green, 0; blue, 255 } ,draw opacity=1 ] (236.86,123.83) .. controls (251.71,103) and (275.48,60.92) .. (340.08,51.12) ;
%Curve Lines [id:da7895559852623824]
\draw [color={rgb, 255:red, 0; green, 0; blue, 255 } ,draw opacity=1 ] (255.83,137.65) .. controls (272.55,112.12) and (292.21,76.56) .. (353.67,61.65) ;
%Curve Lines [id:da5301022002183335]
\draw [color={rgb, 255:red, 0; green, 0; blue, 255 } ,draw opacity=1 ] (279.66,154.18) .. controls (292.21,124.56) and (316.74,82.08) .. (368.79,77.38) ;
%Curve Lines [id:da9304776953786129]
\draw [color={rgb, 255:red, 0; green, 0; blue, 255 } ,draw opacity=1 ] (300.83,165.93) .. controls (312.32,137.34) and (331.21,105.26) .. (381.18,91.37) ;
%Curve Lines [id:da6699188663496267]
\draw [color={rgb, 255:red, 0; green, 0; blue, 255 } ,draw opacity=1 ] (323.56,174.6) .. controls (339.24,139.88) and (347.61,124.56) .. (393.6,103.11) ;
%Curve Lines [id:da09743146493089894]
\draw [color={rgb, 255:red, 0; green, 0; blue, 255 } ,draw opacity=1 ] (321.27,40.2) .. controls (364.33,61.24) and (368.51,82.69) .. (393.6,103.11) ;
%Curve Lines [id:da5833941878945743]
\draw [color={rgb, 255:red, 0; green, 0; blue, 255 } ,draw opacity=1 ] (296.99,45.72) .. controls (340.05,66.76) and (349.34,92.48) .. (374.43,112.9) ;
%Curve Lines [id:da485978835148301]
\draw [color={rgb, 255:red, 0; green, 0; blue, 255 } ,draw opacity=1 ] (273.67,54.91) .. controls (316.74,75.95) and (330.7,105.33) .. (355.79,125.76) ;
%Curve Lines [id:da3031023315418251]
\draw [color={rgb, 255:red, 0; green, 0; blue, 255 } ,draw opacity=1 ] (254.9,67.26) .. controls (297.97,88.3) and (317.53,119.95) .. (342.61,140.37) ;
%Curve Lines [id:da12768400524322754]
\draw [color={rgb, 255:red, 0; green, 0; blue, 255 } ,draw opacity=1 ] (232.9,86.57) .. controls (268.44,115.16) and (306.07,137.63) .. (331.16,158.06) ;
%Curve Lines [id:da9644369612553503]
\draw [color={rgb, 255:red, 0; green, 0; blue, 255 } ,draw opacity=1 ] (214.09,110.06) .. controls (245.45,125.38) and (283.08,164.18) .. (323.56,174.6) ;
%Curve Lines [id:da2979403259506286]
\draw [color={rgb, 255:red, 0; green, 0; blue, 255 } ,draw opacity=1 ] (214.09,110.06) .. controls (228.93,89.22) and (256.67,50.01) .. (321.27,40.2) ;
%Straight Lines [id:da9153995890946751]
\draw [color={rgb, 255:red, 255; green, 0; blue, 0 } ,draw opacity=1 ][line width=0.75] (252.2,57.2) -- (333.2,125.2) ;
%Straight Lines [id:da3662157039260401]
\draw [color={rgb, 255:red, 255; green, 0; blue, 0 } ,draw opacity=1 ][line width=0.75] (292.83,23.48) -- (206.07,92.93) ;
%Straight Lines [id:da03879222202884547]
\draw [color={rgb, 255:red, 255; green, 0; blue, 0 } ,draw opacity=1 ][line width=0.75] (373.83,92.48) -- (287.07,161.93) ;
%Straight Lines [id:da09476200324660056]
\draw [color={rgb, 255:red, 255; green, 0; blue, 0 } ,draw opacity=1 ][line width=0.75] (333.33,58.48) -- (246.57,127.93) ;
%Shape: Ellipse [id:dp8593954805642501]
\draw [color={rgb, 255:red, 0; green, 0; blue, 255 } ,draw opacity=1 ][fill={rgb, 255:red, 255; green, 255; blue, 255 } ,fill opacity=1 ] (288.99,89.74) .. controls (289.75,87.88) and (292.04,87.03) .. (294.09,87.84) .. controls (296.14,88.64) and (297.18,90.8) .. (296.41,92.66) .. controls (295.65,94.52) and (293.36,95.37) .. (291.31,94.56) .. controls (289.26,93.76) and (288.22,91.6) .. (288.99,89.74) -- cycle ;
%Straight Lines [id:da7719451197723761]
\draw [color={rgb, 255:red, 255; green, 0; blue, 0 } ,draw opacity=1 ][line width=0.75] (206.07,93.93) -- (287.07,161.93) ;
%Straight Lines [id:da5632194921787348]
\draw [color={rgb, 255:red, 255; green, 0; blue, 0 } ,draw opacity=1 ][line width=0.75] (292.83,23.48) -- (373.83,91.48) ;
% Text Node
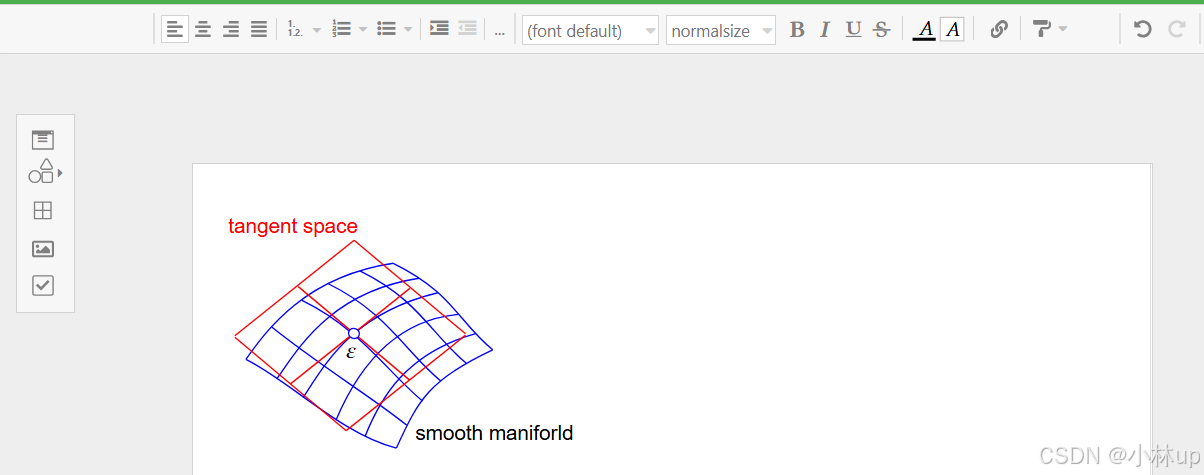
\draw (200,5) node [anchor=north west][inner sep=0.75pt] [color={rgb, 255:red, 255; green, 0; blue, 0 } ,opacity=1 ] [align=left] {tangent space};
% Text Node
\draw (336,156) node [anchor=north west][inner sep=0.75pt] [align=left] {smooth maniforld};
% Text Node
\draw (284,95.4) node [anchor=north west][inner sep=0.75pt] {$\varepsilon $};
\end{tikzpicture}
\caption{manifold and tangent space}
\label{fig}
\end{figure}
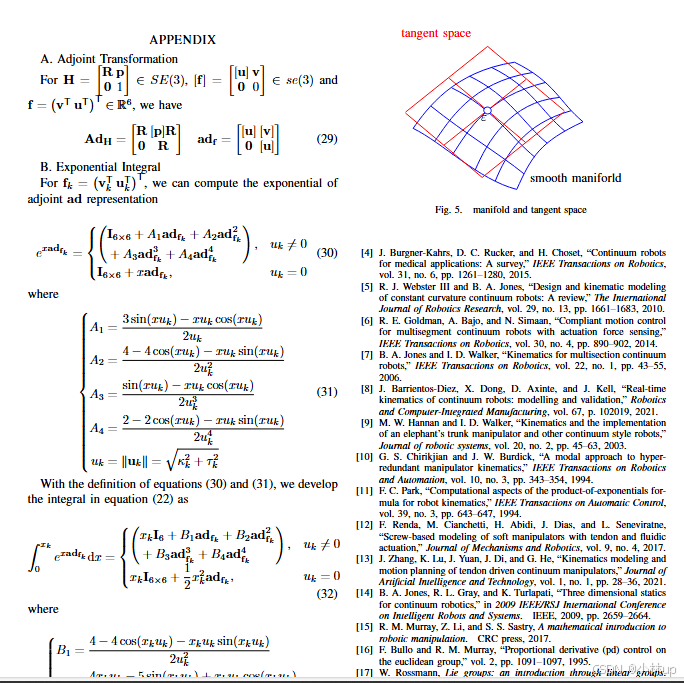
编译后成功显示:


 1360
1360

 被折叠的 条评论
为什么被折叠?
被折叠的 条评论
为什么被折叠?
 到【灌水乐园】发言


