


Using Developer Tools and enable all macros and trust to the VBA project object model.
/
Basic Operation
Very Basic
- Enter multiple lines in a cell
Press F2 to input content and [Alt + Enter] to line feed. - Wrap text in a cell
When text goes beyond the width of a cell, if [Wrap text] under [Format Cells] –> [Alignment] is not checked, text will keep display on the same line.
Navigating
| Keys | Functions |
|---|---|
| [Ctrl + G] | Enter the position of a particular cell and Jump to it. |
| [Ctrl + Arrows] | Go to the cell of a whole table on the side |
| [Home] | Go to Beginning of row |
| [Ctrl + Home] | Go to cell A1 |
| [Ctrl + End ] | Go to Bottom-most used row & Rightmost used column |
| [Page Up ] | Go up one page |
| [Page Down ] | Go down one page |
| [Alt + Page Up ] | Go left one page |
| [Alt + Page Down] | Go right one page |
| [Ctrl + Page Up ] | Go to left worksheet |
| [Ctrl + Page Down] | Go to right worksheet |
| [Ctrl] + select some grid | Select more than one grid |
| [Ctrl + Shift + Arrowkey] | Selecting a ranges of cells using keyboard shortcuts |
Copy & Paste
Copy and Paste + keyboard shortcuts :
- Activate the first cell.
- Press [Ctrl + Shift + Arrow] to select the area.
- Press [Ctrl + C] to copy.
- Activate the first cell to paste.
- Press [Ctrl + V] to paste.
Copy and Paste + matrix transpose:
- Activate the first cell.
- Press [Ctrl + Shift + Arrow] to select the area.
- Press [Ctrl + C] to copy.
- Activate the first cell to paste.
- Press [Home] → [Paste] → [Paste Special….]
- Check [Transpose] and click [OK]
Copy and Paste + Formats / Values:
- Activate the first cell.
- Press [Ctrl + Shift + Arrow] to select the area.
- Press [Ctrl + C] to copy.
- Activate the first cell to paste.
- Press [Home] → [Paste] → [Paste Special….]
- Check [Formats] and click [OK]
- Check [Values] and click [OK]
- ….
Formatting Cells
- Decimal Places and Number Alignments: [Ctrl + 1] to edit.
- Date and Time
Date -> Integer:"1" represents "1 January 1990"
Time -> Decimal:"0.00" represents "12:00 AM" - Conditional Formatting
Choose [Home] -> [Conditional Formatting…]
To create or manage conditional rules
Formula
- Relative and Absolute Cell References:
Press F4 : To get absolute references, prefix the column and/or row label by a ‘$’ character. - Range Names:
It can can make formula easier to understand.
- Range name
Press [Ctrl + F3] or select [Formulas] -> [Define Name] from the menu. - Creating Names Automatically
Select [Formulas] -> [Create from Selection] from the menu. Check [Left column] only in the Create Names dialogue and press [Enter].
- Range name
- Formula Auditing
- Trace: select the cell and click [Formulas] –> [Trace Precedents] to trace the source of the formula.
- Evaluate: Select the cell and click [Formulas] –> [Evaluate Formula] to invoke the Evaluate Formula dialogue.
Build-In Functions
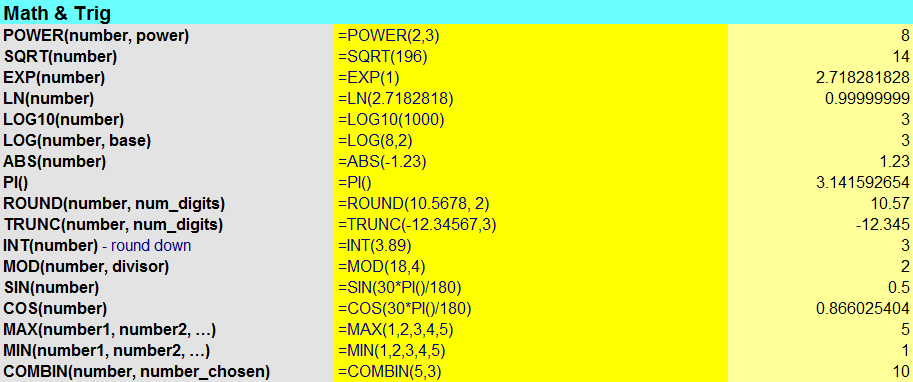
Math & Trig
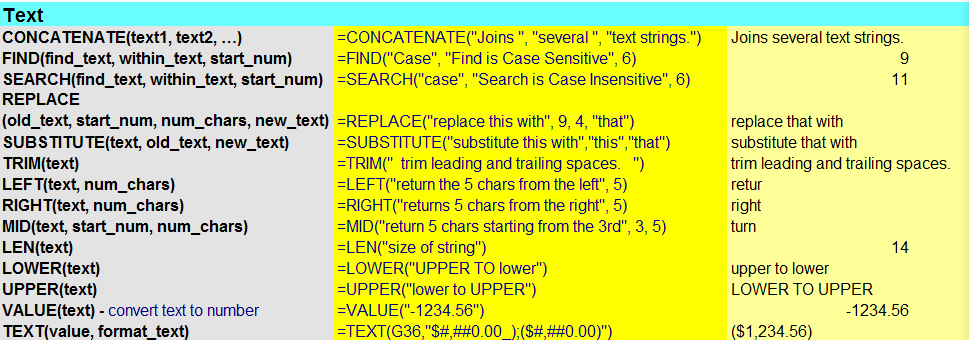
Text
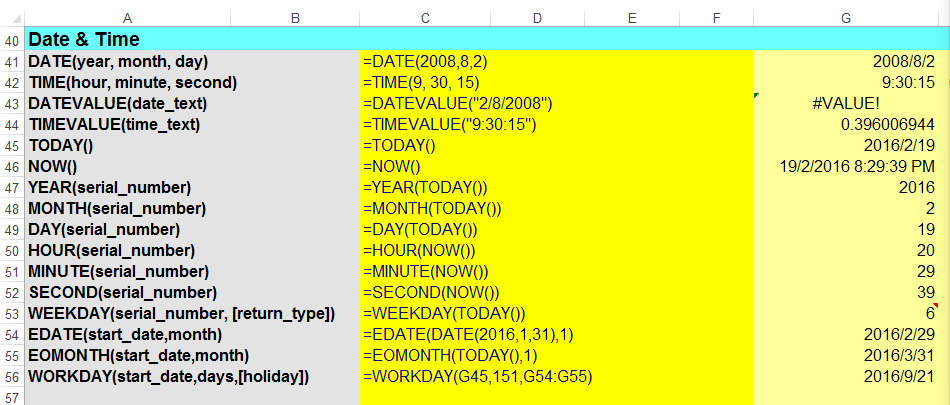
Date & Time
Other Function
Logical Functions
- IF(logical_test, value_if_true, value_if_false)
- AND(logical1, logical2, …)
- OR(logical1, logical2, …)
- NOT(logical1)
Lookup
- VLOOKUP(lookup_value, table_array, row_index_number, range_lookup)
- MATCH(lookup_value, lookup_array, match_type)
- INDEX(array, row_num, col_num)
Matrix
Select the answer area and enter the formula, Finally press [Shift + Ctrl + Enter]
- Multiply: MMULT(array1, array2)
- Inverse: MINVERSE(array)
- Transpose: TRANSPOSE(array)
Time Value
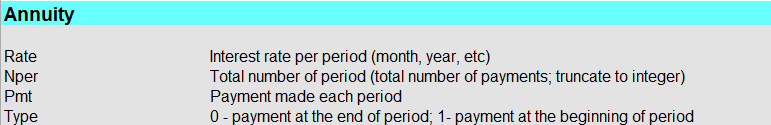
- Present Value: PV(rate, nper, pmt, fv, type)
- Future Value: FV(rate, nper, pmt, pv, type)
- Payment[period(yearly/monthly/…0)]: PMT(rate, nper, pmt, pv, type)
- NPV = 0
- Present Value of all payment = the money you borrow
- Rate of Payment[same as payment]: RATE(nper, pmt, pv, fv, type, guess)
- Number of period[same as payment]: NPER(rate, pmt, pv, fv, type)
- NPV: NPV(rate, value1, value2, …)
- IRR(Internal Rate of Return: figure out the rate): IRR(values, guess)
Statistical
Statistics
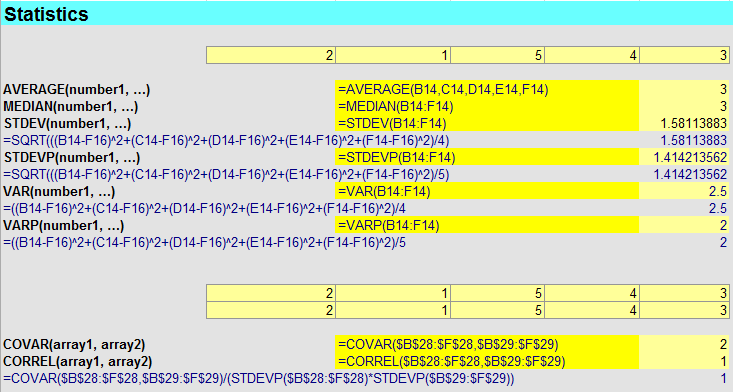
- STDEV is used when the group of numbers being evaluated are only a partial sampling of the whole population. The denominator for dividing the sum of squared deviations is N-1, where N is the number of observations ( a count of items in the data set ). Technically, subtracting the 1 is referred to as “non-biased.”
[Sample] - STDEVP is used when the group of numbers being evaluated is complete - it’s the entire population of values. In this case, the 1 is NOT subtracted and the denominator for dividing the sum of squared deviations is simply N itself, the number of observations ( a count of items in the data set ). Technically, this is referred to as “biased.” Remembering that the P in STDEVP stands for “population” may be helpful. Since the data set is not a mere sample, but constituted of ALL the actual values, this standard deviation function can return a more precise result.
[Total]
Normal Distribution
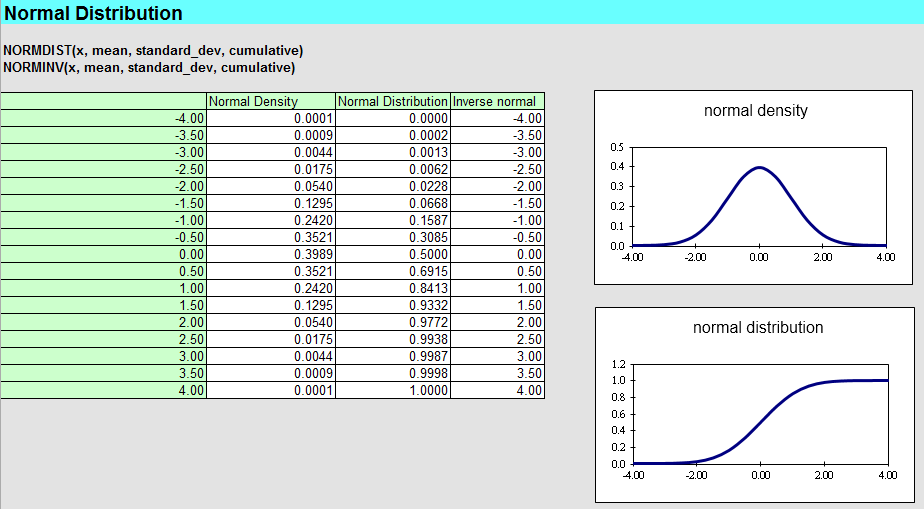
- NORMDIST:
- cumulative = 0: Normal Density[The function value of the normal distribution].
- cumulative = 1: Normal distribution[The probability of normal distribution. The area under the curve at that point.].
- NORMINV: The inverse function of the formula.
- Normal Variates
uniform distributed 均匀分布
- Normal Variates
Random Function
- RAND(): Every time the worksheet is recalculated, RAND will generate a new random number in that cell.
- Frequency Function
FREQUENCY(data_array, bins_array) calculate the number of the frequency. Select the area and enter the formula, finally press [Shift + Ctrl + Enter]. (Select the area and the insert the chart. )
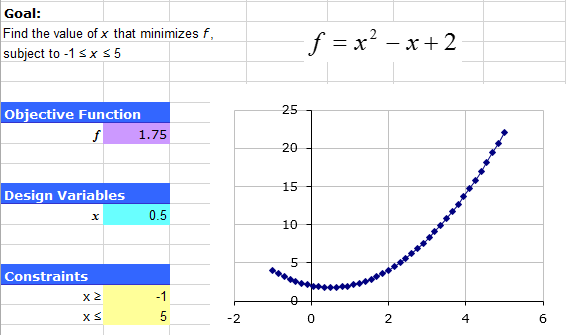
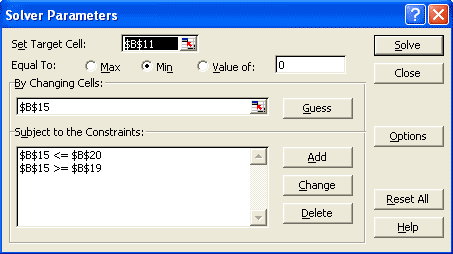
Solver
Find the value of design variables in the objective function with some constrains(minimum/maximum/value).
- Add-In the Solver
Go to Office Button (Top Left Corner). Click Excel Options. Under Add-Ins, enable Solver. To invoke Solver, press [Data] → [Solver] - Example
Model
Monte Carlo Simulation
Lecture 2
Security Price Model
Lecture 3
Table
Data Table
It is a tool to calculate multiple results in the table automatically.
Operation:
1. Enter the column values and row values. Also the formula to be calculate is needed.
2. Select the whole table.
3. Press [Data] -> [What-If Analysis] ->[Data Table]
4. Select the input value of row and/or column, which is the variable in the formula. Finally select [OK].
P.S. NominalRate(Annual)=erate−1
Pivot Table
It is a tool to generate summary data table from raw data by filtering some data according to requirements.
Operation:
1. Press [Insert] -> [Pivot Table]
2. Select an input table or range
3. Select output location
4. Press[OK]
5. Build the summary table by Pivot Table UI. (Select the row labels, column labels, values, …)
Misc
Sort
- Select the whole table
- Press [Data] -> [Sort]
- Set the sort setting depend on the requirement
Filter
- Select the whole table
- Press [Data] -> [Filter]
- Filter some value in the column by unselecting some value.
Data Validation
It maybe force the user to pick some value out of the list they need but not anything they want . It needs to choose the source values.
1. Select the cell
2. Press [Data] -> [Data Valid]
3. Select the source value and press[OK].
Freeze Panes
[View] -> [Freeze Panes] -> […]
The Pane will be freeze during rolling.(The first column and the first row)
Click again to unfreeze the pane.
Split
Split the screen when you have a big table.
[View] -> [Split]


 1444
1444

 被折叠的 条评论
为什么被折叠?
被折叠的 条评论
为什么被折叠?
 到【灌水乐园】发言


