


本文在 Scatterplots (ggplot2) 的基础上加入了自己的理解
对于连续型数据轴和离散型数据轴
# Some sample data
dat <- read.table(header=TRUE, text='
     cond result
  control     10
treatment   11.5
')

library(ggplot2)
# 基础图形
bp <- ggplot(dat, aes(x=cond, y=result)) +
geom_bar(position=position_dodge(), stat="identity")
bp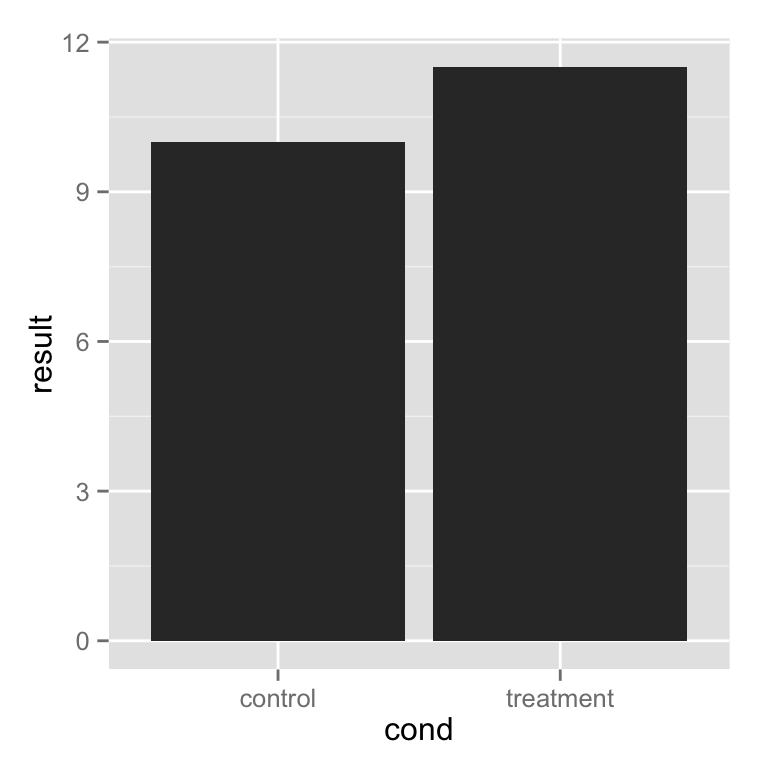
# 添加一条水平线
bp + geom_hline(aes(yintercept=12))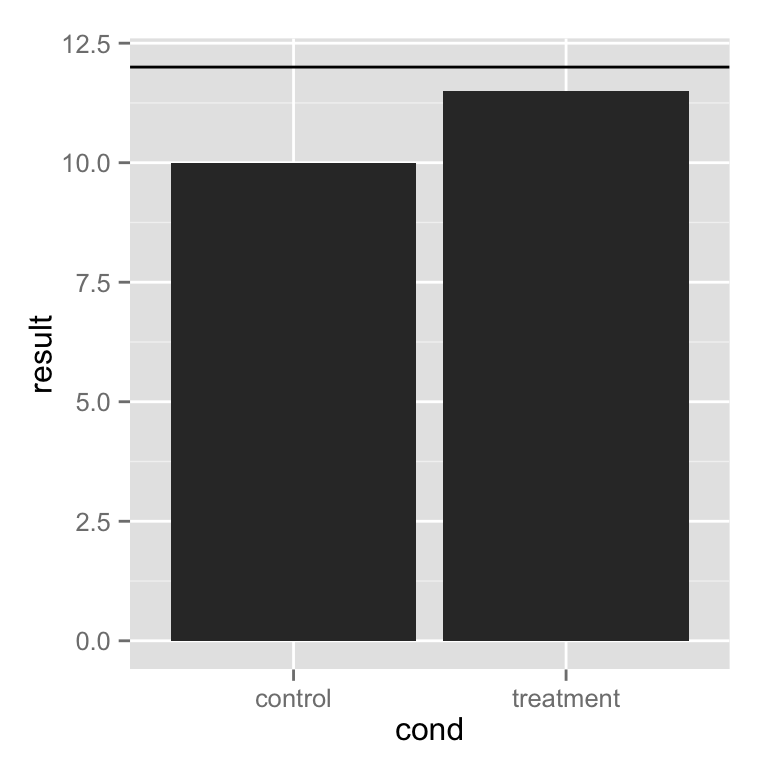
# linetype 设置线型为 虚线
bp + geom_hline(aes(yintercept=12), colour="#990000", linetype="dashed")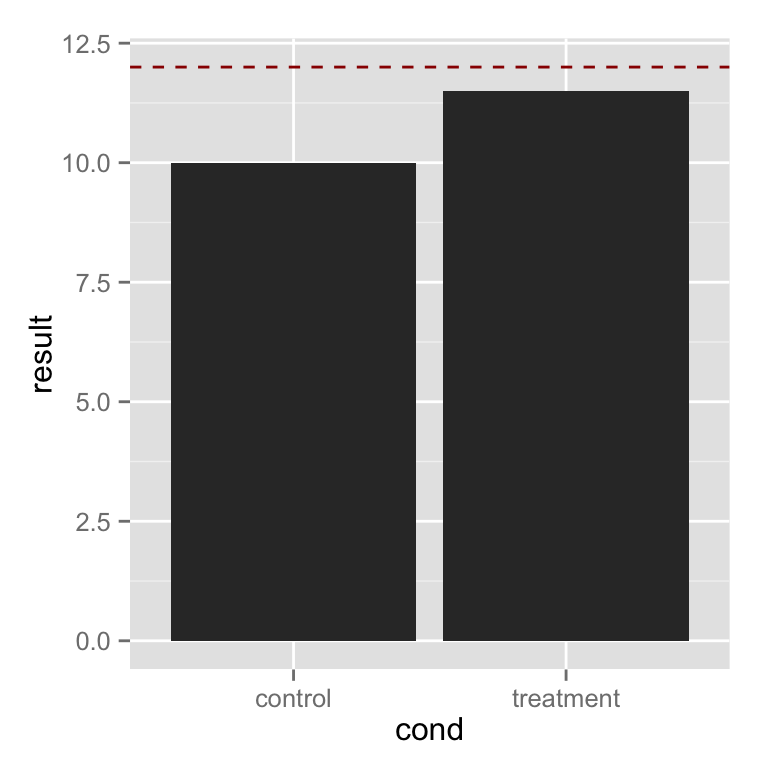
根据分类情况,添加直线
# Draw separate hlines for each bar. First add another column to dat
dat$hline <- c(9,12)
dat
## cond result hline
## 1 control 10.0 9
## 2 treatment 11.5 12# Need to re-specify bp, because the data has changed
bp <- ggplot(dat, aes(x=cond, y=result)) +
geom_bar(position=position_dodge(), stat="identity")
# 对每一个条形添加分割线
bp + geom_errorbar(aes(y=hline, ymax=hline, ymin=hline), colour="#AA0000")
bp + geom_errorbar(width=0.5, # 设置线宽度
                   aes(y=hline, ymax=hline, ymin=hline), colour="#AA0000")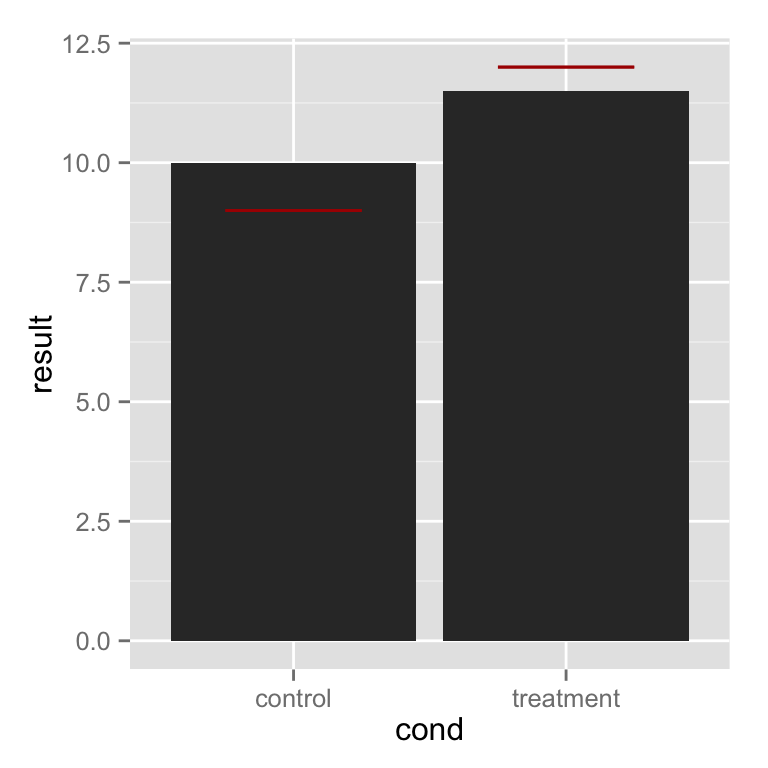
# 重新定义数据
dat_hlines <- data.frame(cond=c("control","treatment"), hline=c(9,12))
dat_hlines
## cond hline
## 1 control 9
## 2 treatment 12# 条形图的数据来自于 dat, 但是 线的数据来自于 dat_hlines
bp + geom_errorbar(data=dat_hlines, aes(y=hline, ymax=hline, ymin=hline), colour="#AA0000")
直线穿过各组数据
这里实际上是有4条线, 但是前两条线与后两条线的数值相同,看上去是两条线.
dat <- read.table(header=TRUE, text='
     cond group result hline
  control     A     10     9
treatment     A   11.5    12
  control     B     12     9
treatment     B     14    12
')
dat
## cond group result hline
## 1 control A 10.0 9
## 2 treatment A 11.5 12
## 3 control B 12.0 9
## 4 treatment B 14.0 12# Define basic bar plot
bp <- ggplot(dat, aes(x=cond, y=result, fill=group)) +
geom_bar(position=position_dodge(), stat="identity")
bp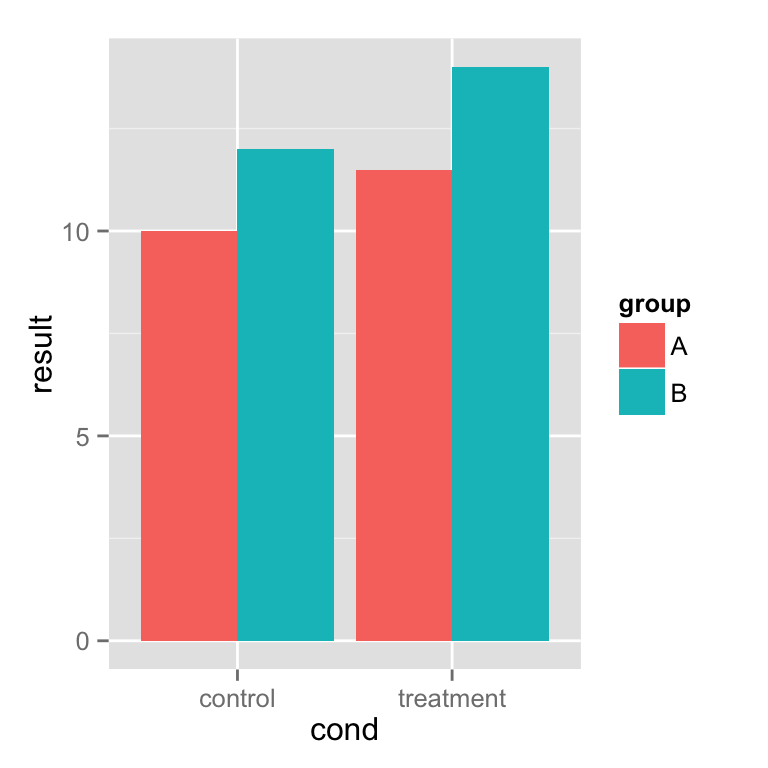
# The error bars get plotted over one another -- there are four but it looks
# like two
bp + geom_errorbar(aes(y=hline, ymax=hline, ymin=hline), linetype="dashed")
每组数据分别划线
dat <- read.table(header=TRUE, text='
cond group result hline
control A 10 11
treatment A 11.5 12
control B 12 12.5
treatment B 14 15
')
# Define basic bar plot
bp <- ggplot(dat, aes(x=cond, y=result, fill=group)) +
    geom_bar(position=position_dodge(), stat="identity")
bp
bp + geom_errorbar(aes(y=hline, ymax=hline, ymin=hline), linetype="dashed",
                   position=position_dodge())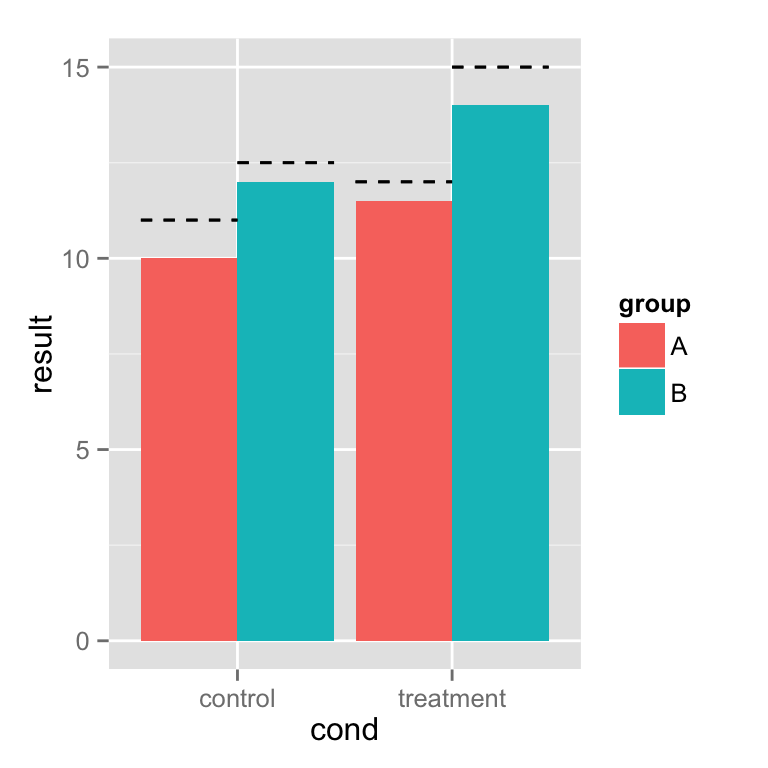
为连续型数据轴添加直线
dat <- read.table(header=TRUE, text='
      cond xval yval
   control 11.5 10.8
   control  9.3 12.9
   control  8.0  9.9
   control 11.5 10.1
   control  8.6  8.3
   control  9.9  9.5
   control  8.8  8.7
   control 11.7 10.1
   control  9.7  9.3
   control  9.8 12.0
 treatment 10.4 10.6
 treatment 12.1  8.6
 treatment 11.2 11.0
 treatment 10.0  8.8
 treatment 12.9  9.5
 treatment  9.1 10.0
 treatment 13.4  9.6
 treatment 11.6  9.8
 treatment 11.5  9.8
 treatment 12.0 10.6
')

library(ggplot2)
Basic lines
# 基本散点图
sp <- ggplot(dat, aes(x=xval, y=yval, colour=cond)) + geom_point()

# 水平线
sp + geom_hline(aes(yintercept=10))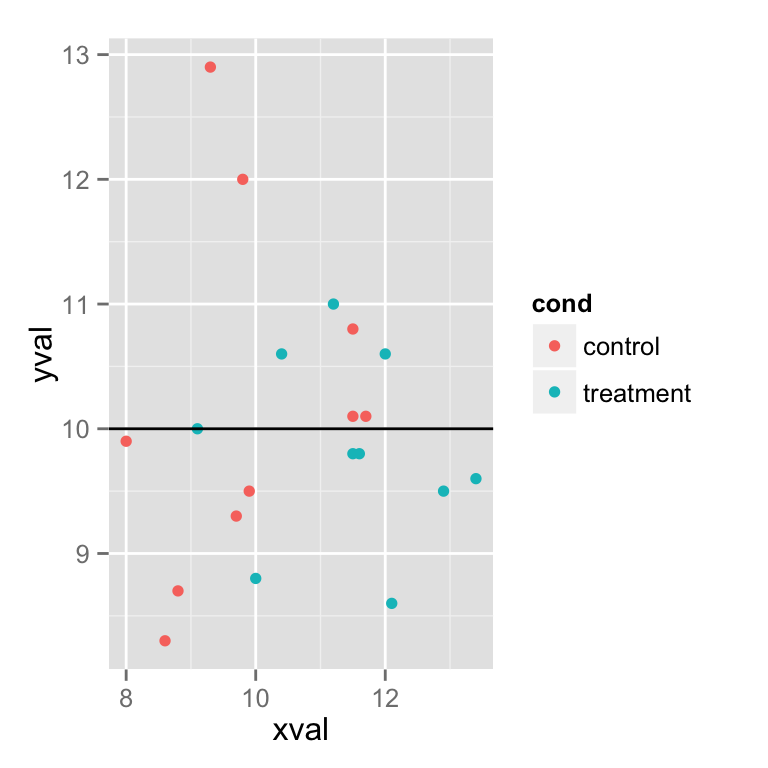
# 垂直虚线
sp + geom_hline(aes(yintercept=10)) +
    geom_vline(aes(xintercept=11.5), colour="#BB0000", linetype="dashed")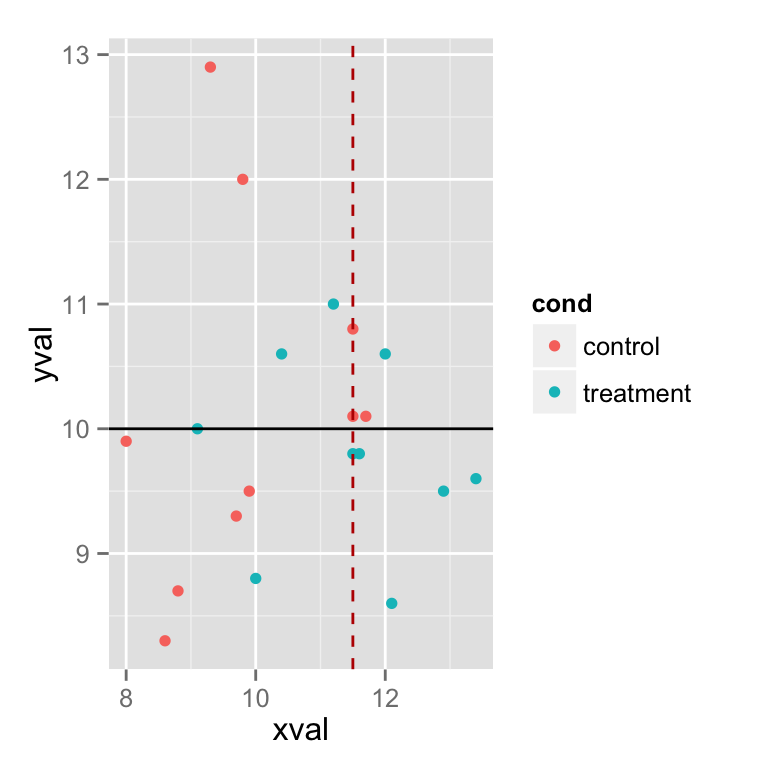
为均值自动划线
# Add colored lines for the mean xval of each group
sp + geom_hline(aes(yintercept=10)) +
     geom_line(stat="vline", xintercept="mean")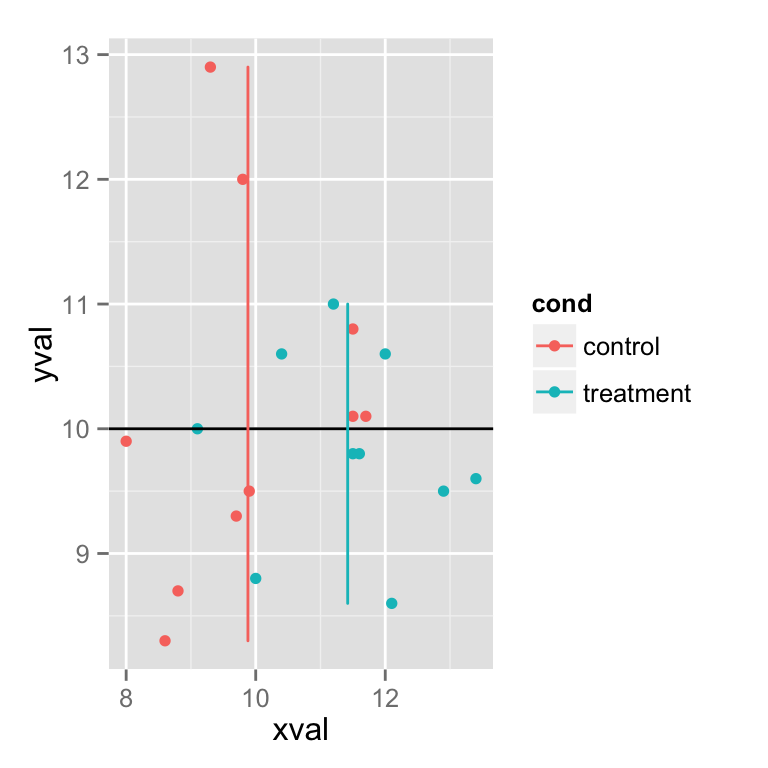
# 根据 cond 分面
spf <- sp + facet_grid(. ~ cond)
spf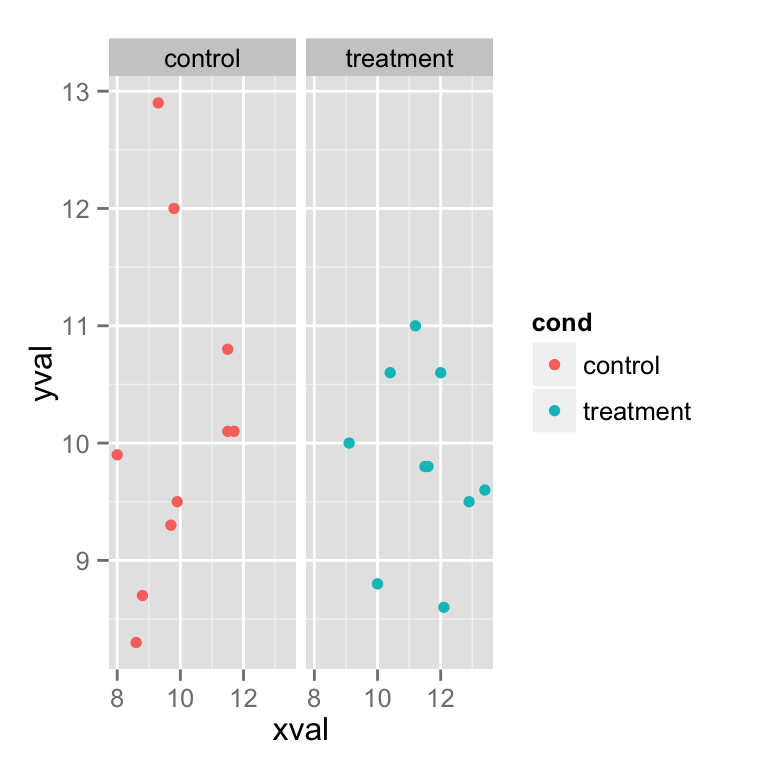
# 在所有的面上划线
spf + geom_hline(aes(yintercept=10))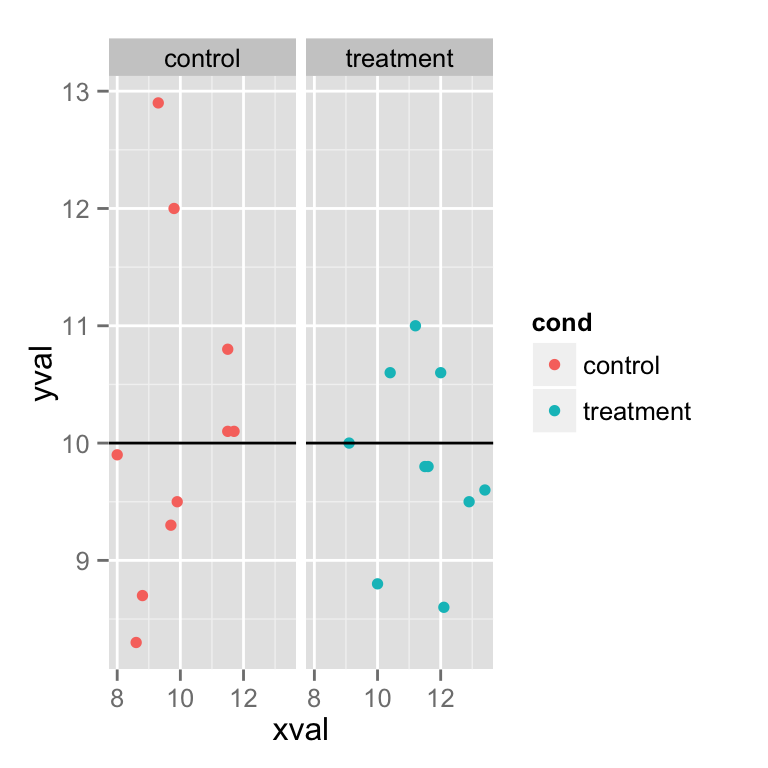
如果想为不同的分面, 添加不同的直线, 这里有两种设置. 一种是重新生成一个满足数据需要的 data.frame 另一种是使用 geom_line() 的stat和xintercept
# 第一种方法
dat_vlines <- data.frame(cond=levels(factor(dat$cond)), xval=c(10,11.5))
dat_vlines
## cond xval
## 1 control 10.0
## 2 treatment 11.5spf + geom_hline(aes(yintercept=10)) +
geom_vline(aes(xintercept=xval), data=dat_vlines,
colour="#990000", linetype="dashed")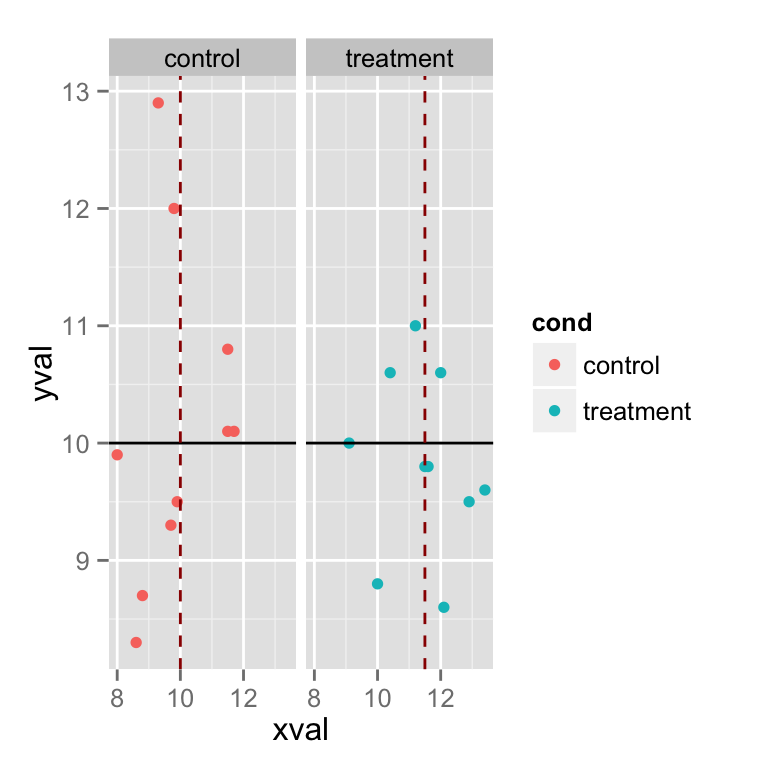
# 第二种方法
spf + geom_hline(aes(yintercept=10)) +
      geom_line(stat="vline", xintercept="mean")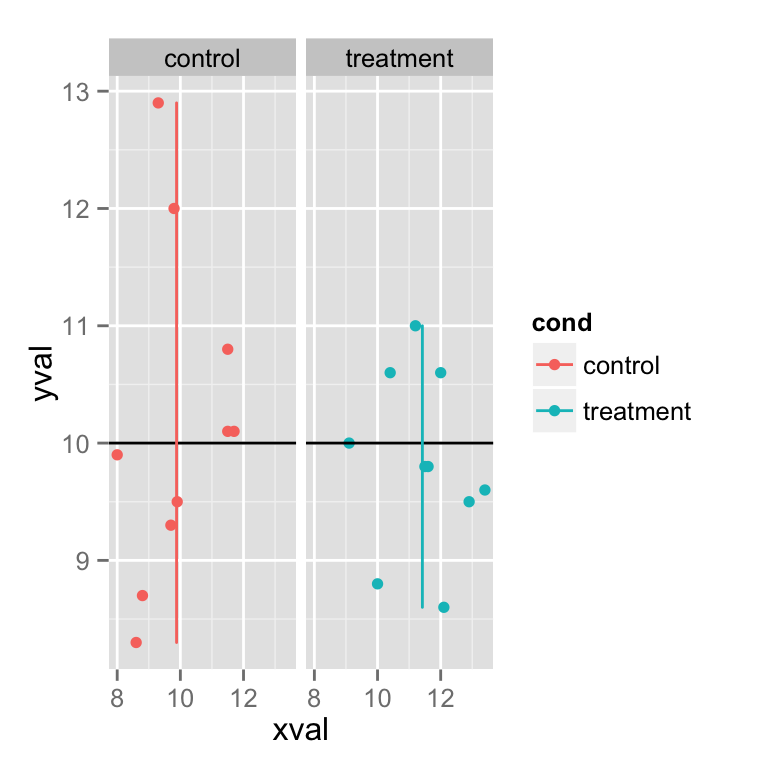


 1136
1136

 被折叠的 条评论
为什么被折叠?
被折叠的 条评论
为什么被折叠?
 到【灌水乐园】发言


