


from sklearn.datasets import fetch_20newsgroups
news = fetch_20newsgroups(subset='all')
print(len(news.data))
print(news.data[0])
from sklearn.cross_validation import train_test_split
X_train,X_test,y_train,y_test=train_test_split(news.data,news.target,test_size=0.25,random_state=33)
from sklearn.feature_extraction.text import CountVectorizer,TfidfVectorizer


count_filter_vec = CountVectorizer(analyzer='word',stop_words='english')

tfidf_filter_vec = TfidfVectorizer(analyzer='word',stop_words='english')

X_count_filter_train = count_filter_vec.fit_transform(X_train)
X_count_filter_test = count_filter_vec.transform(X_test)


X_tfidf_filter_train = tfidf_filter_vec.fit_transform(X_train)
X_tfidf_filter_test= tfidf_filter_vec.transform(X_test)


from sklearn.naive_bayes import MultinomialNB
mnb_count = MultinomialNB()

mnb_count.fit(X_count_filter_train,y_train)

print('The accuracy of  Classifier 20newsgroups using Native Bayes (countvectorizer by filtering stopwords: ',mnb_count.score(X_count_filter_test,y_test))


y_count_filter_predict = mnb_count.predict(X_count_filter_test)


mnb_count.fit(X_tfidf_filter_train,y_train)

print('The accuracy of  Classifier 20newsgroups using Native Bayes (Tfidf by filtering stopwords: ',mnb_count.score(X_tfidf_filter_test,y_test))


y_Tfidf_filter_predict = mnb_count.predict(X_tfidf_filter_test)

from sklearn.metrics import classification_report

print(classification_report(y_test,y_count_filter_predict,target_names = news.target_names))

from matplotlib import pyplot as plt
import numpy as np

def show_values(pc, fmt="%.2f", **kw):
    '''
    Heatmap with text in each cell with matplotlib's pyplot
    Source: https://stackoverflow.com/a/25074150/395857
    By HYRY
    '''
    global zip
    import  itertools
    zip = getattr(itertools, 'izip', zip)
    pc.update_scalarmappable()
    ax = pc.axes
    for p, color, value in  zip(pc.get_paths(), pc.get_facecolors(), pc.get_array()):
        x, y = p.vertices[:-2, :].mean(0)
        if np.all(color[:3] > 0.5):
            color = (0.0, 0.0, 0.0)
        else:
            color = (1.0, 1.0, 1.0)
        ax.text(x, y, fmt % value, ha="center", va="center", color=color, **kw)


def cm2inch(*tupl):
    '''
    Specify figure size in centimeter in matplotlib
    Source: https://stackoverflow.com/a/22787457/395857
    By gns-ank
    '''
    inch = 2.54
    if type(tupl[0]) == tuple:
        return tuple(i/inch for i in tupl[0])
    else:
        return tuple(i/inch for i in tupl)


def heatmap(AUC, title, xlabel, ylabel, xticklabels, yticklabels, figure_width=40, figure_height=20, correct_orientation=False, cmap='RdBu'):
    '''
    Inspired by:
    - https://stackoverflow.com/a/16124677/395857
    - https://stackoverflow.com/a/25074150/395857
    '''

    # Plot it out
    fig, ax = plt.subplots()
    #c = ax.pcolor(AUC, edgecolors='k', linestyle= 'dashed', linewidths=0.2, cmap='RdBu', vmin=0.0, vmax=1.0)
    c = ax.pcolor(AUC, edgecolors='k', linestyle= 'dashed', linewidths=0.2, cmap=cmap)

    # put the major ticks at the middle of each cell
    ax.set_yticks(np.arange(AUC.shape[0]) + 0.5, minor=False)
    ax.set_xticks(np.arange(AUC.shape[1]) + 0.5, minor=False)

    # set tick labels
    #ax.set_xticklabels(np.arange(1,AUC.shape[1]+1), minor=False)
    ax.set_xticklabels(xticklabels, minor=False)
    ax.set_yticklabels(yticklabels, minor=False)

    # set title and x/y labels
    plt.title(title)
    plt.xlabel(xlabel)
    plt.ylabel(ylabel)

    # Remove last blank column
    plt.xlim( (0, AUC.shape[1]) )

    # Turn off all the ticks
    ax = plt.gca()
    for t in ax.xaxis.get_major_ticks():
        t.tick1On = False
        t.tick2On = False
    for t in ax.yaxis.get_major_ticks():
        t.tick1On = False
        t.tick2On = False

    # Add color bar
    plt.colorbar(c)

    # Add text in each cell
    show_values(c)

    # Proper orientation (origin at the top left instead of bottom left)
    if correct_orientation:
        ax.invert_yaxis()
        ax.xaxis.tick_top()

    # resize
    fig = plt.gcf()
    #fig.set_size_inches(cm2inch(40, 20))
    #fig.set_size_inches(cm2inch(40*4, 20*4))
    fig.set_size_inches(cm2inch(figure_width, figure_height))


def plot_classification_report(classification_report, title='Classification report ', cmap='RdBu'):
    '''
    Plot scikit-learn classification report.
    Extension based on https://stackoverflow.com/a/31689645/395857
    '''
    lines = classification_report.split('\n')

    classes = []
    plotMat = []
    support = []
    class_names = []
    for line in lines[2 : (len(lines) - 2)]:
        t = line.strip().split()
        if len(t) < 2: continue
        classes.append(t[0])
        v = [float(x) for x in t[1: len(t) - 1]]
        support.append(int(t[-1]))
        class_names.append(t[0])
        print(v)
        plotMat.append(v)

    print('plotMat: {0}'.format(plotMat))
    print('support: {0}'.format(support))

    xlabel = 'Metrics'
    ylabel = 'Classes'
    xticklabels = ['Precision', 'Recall', 'F1-score']
    yticklabels = ['{0} ({1})'.format(class_names[idx], sup) for idx, sup  in enumerate(support)]
    figure_width = 25
    figure_height = len(class_names) + 7
    correct_orientation = False
    heatmap(np.array(plotMat), title, xlabel, ylabel, xticklabels, yticklabels, figure_width, figure_height, correct_orientation, cmap=cmap)

#传入相应的report结果
def main():
    sampleClassificationReport =classification_report(y_test,y_count_filter_predict,target_names = news.target_names)
    plot_classification_report(sampleClassificationReport)
    plt.savefig('countvector_plot_classif_report.png', dpi=200, format='png', bbox_inches='tight')
    plt.close()

    sampleClassificationReport1 =classification_report(y_test,y_Tfidf_filter_predict,target_names = news.target_names)
    plot_classification_report(sampleClassificationReport1)
    plt.savefig('tfidfvector_plot_classif_report1.png', dpi=200, format='png', bbox_inches='tight')
    plt.close()

if __name__ == "__main__":
    main()
    #cProfile.run('main()') # if you want to do some profiling

print(classification_report(y_test,y_Tfidf_filter_predict,target_names = news.target_names))
提示错误:
Traceback (most recent call last):
  File "D:\Python35\demo\count_vectorizer_stop.py", line 189, in <module>
    main()
  File "D:\Python35\demo\count_vectorizer_stop.py", line 179, in main
    plot_classification_report(sampleClassificationReport)
  File "D:\Python35\demo\count_vectorizer_stop.py", line 174, in plot_classification_report
    heatmap(np.array(plotMat), title, xlabel, ylabel, xticklabels, yticklabels, figure_width, figure_height, correct_orientation, cmap=cmap)
NameError: name 'np' is not defined
导入相应的架包 numpy
运行结果如下:
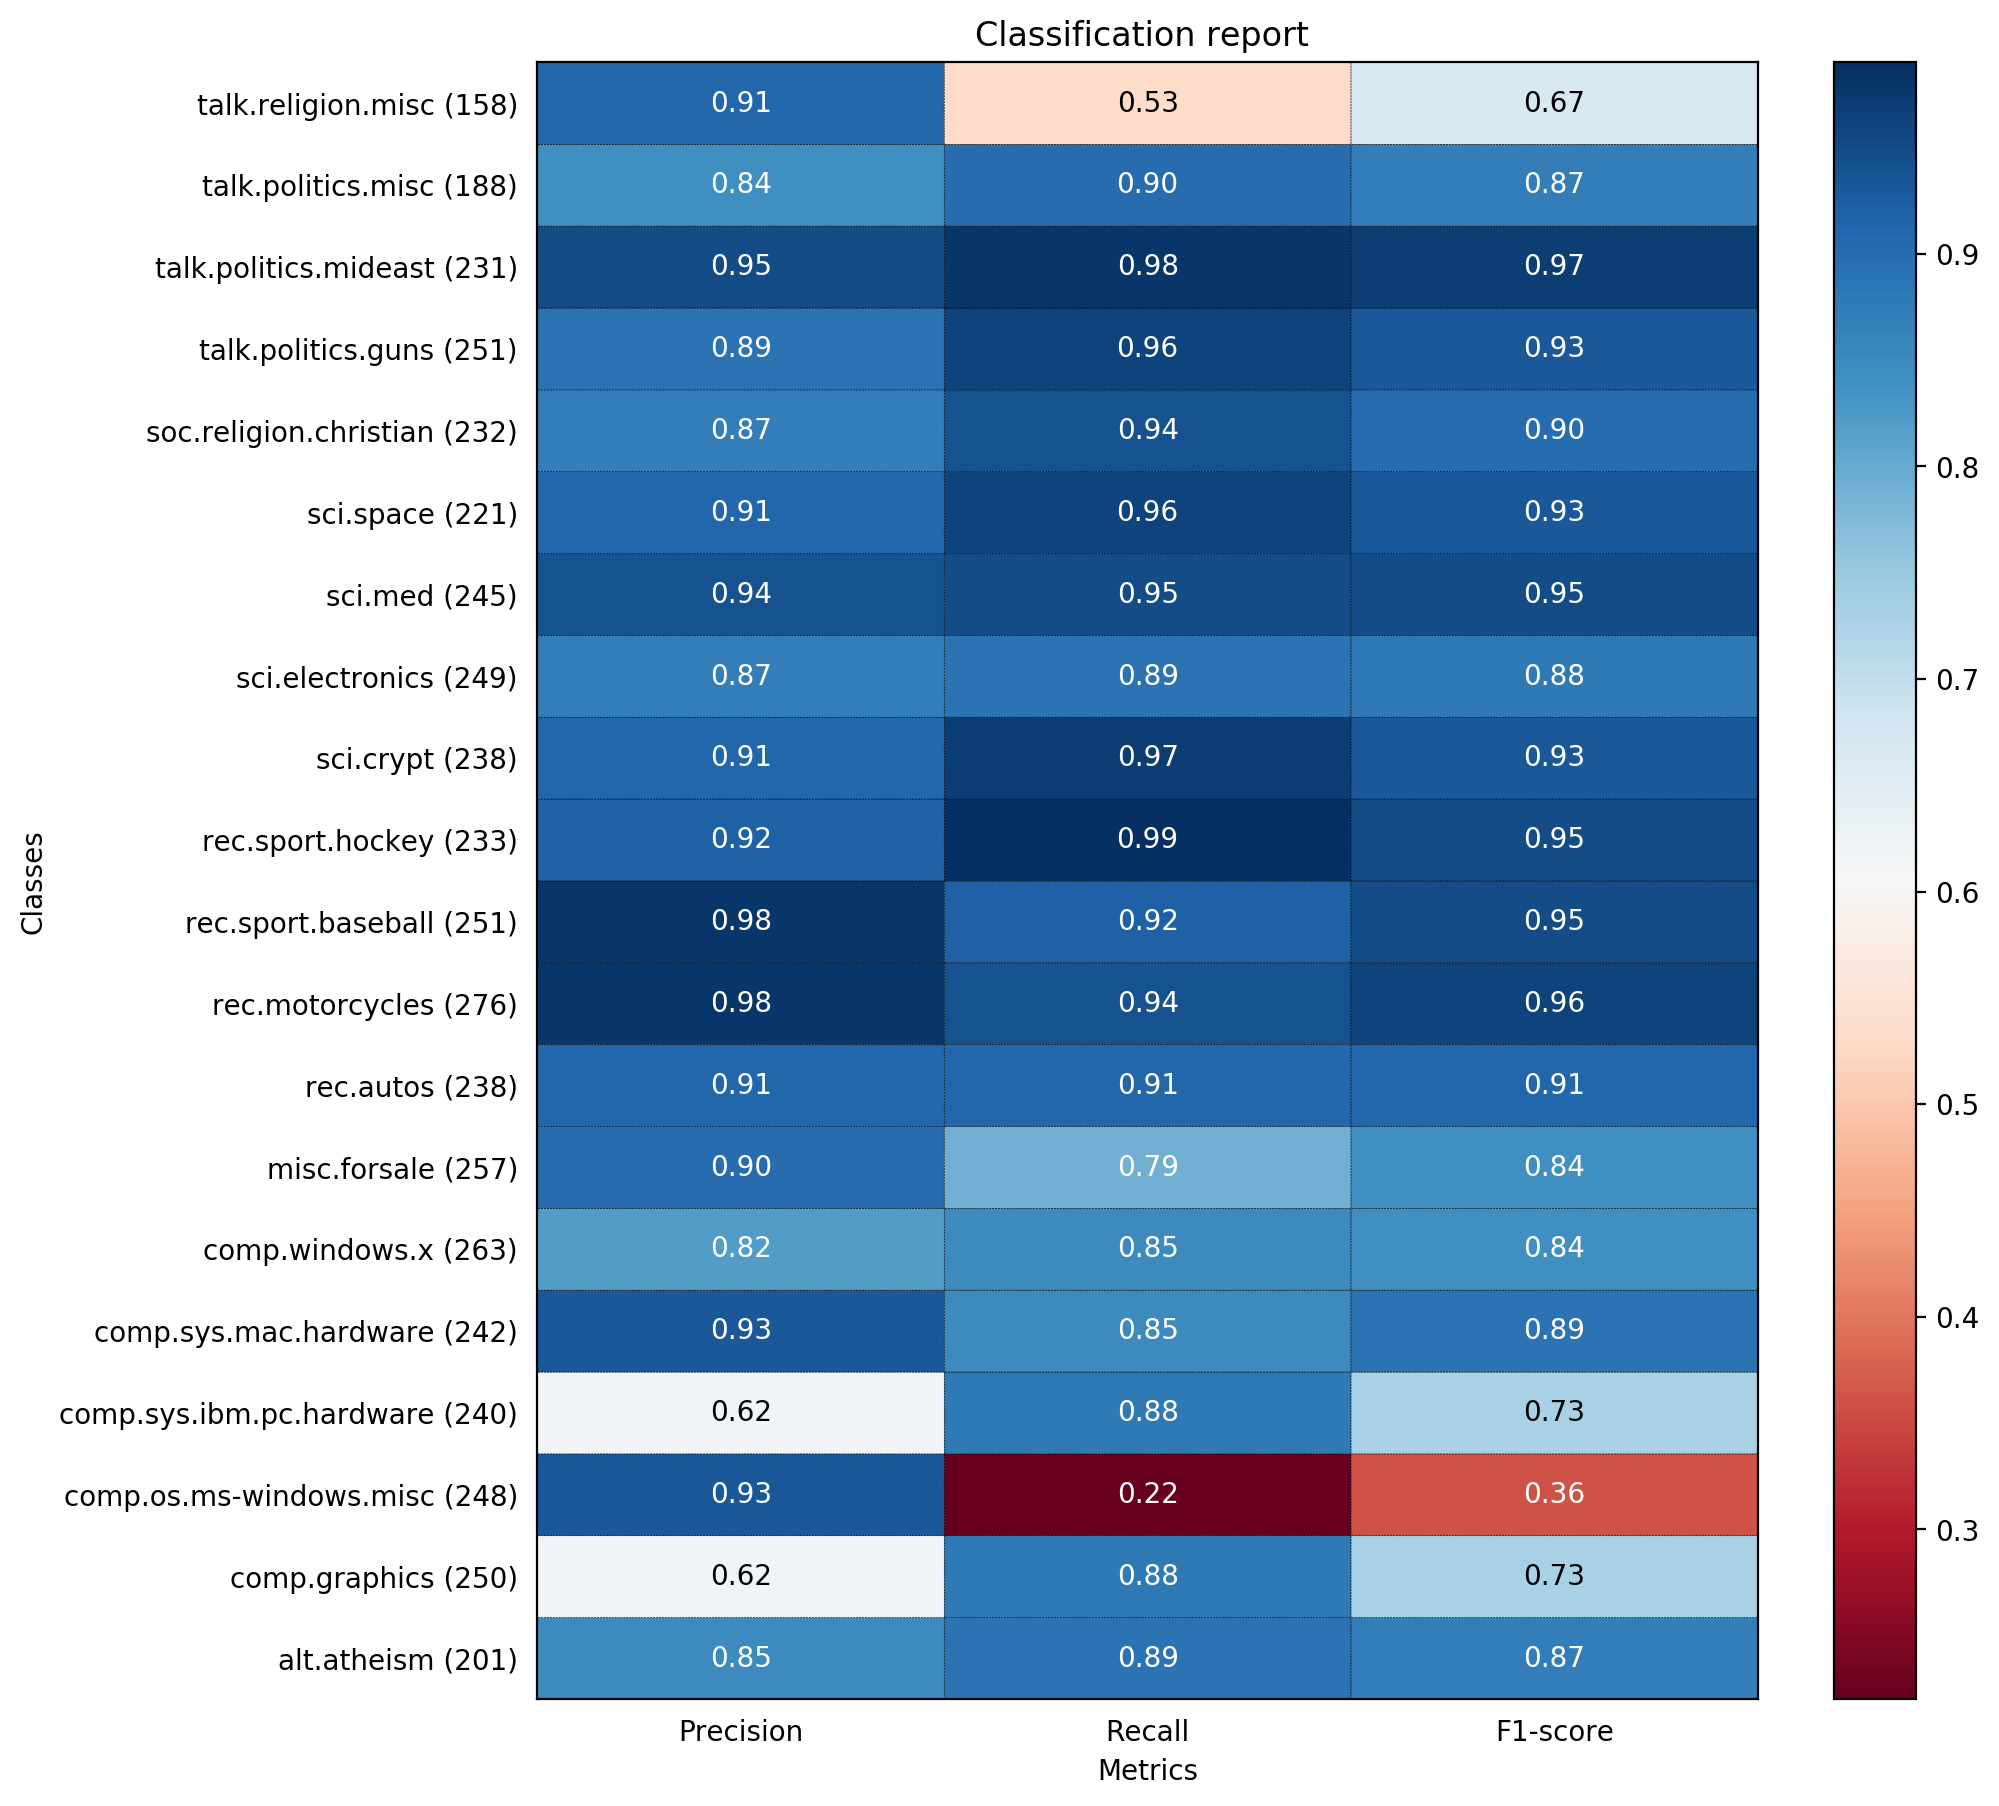
                      precision    recall  f1-score   support

             alt.atheism       0.85      0.89      0.87       201
           comp.graphics       0.62      0.88      0.73       250
 comp.os.ms-windows.misc       0.93      0.22      0.36       248
comp.sys.ibm.pc.hardware       0.62      0.88      0.73       240
   comp.sys.mac.hardware       0.93      0.85      0.89       242
          comp.windows.x       0.82      0.85      0.84       263
            misc.forsale       0.90      0.79      0.84       257
               rec.autos       0.91      0.91      0.91       238
         rec.motorcycles       0.98      0.94      0.96       276
      rec.sport.baseball       0.98      0.92      0.95       251
        rec.sport.hockey       0.92      0.99      0.95       233
               sci.crypt       0.91      0.97      0.93       238
         sci.electronics       0.87      0.89      0.88       249
                 sci.med       0.94      0.95      0.95       245
               sci.space       0.91      0.96      0.93       221
  soc.religion.christian       0.87      0.94      0.90       232
      talk.politics.guns       0.89      0.96      0.93       251
   talk.politics.mideast       0.95      0.98      0.97       231
      talk.politics.misc       0.84      0.90      0.87       188
      talk.religion.misc       0.91      0.53      0.67       158

             avg / total       0.88      0.86      0.85      4712
precision recall f1-score support
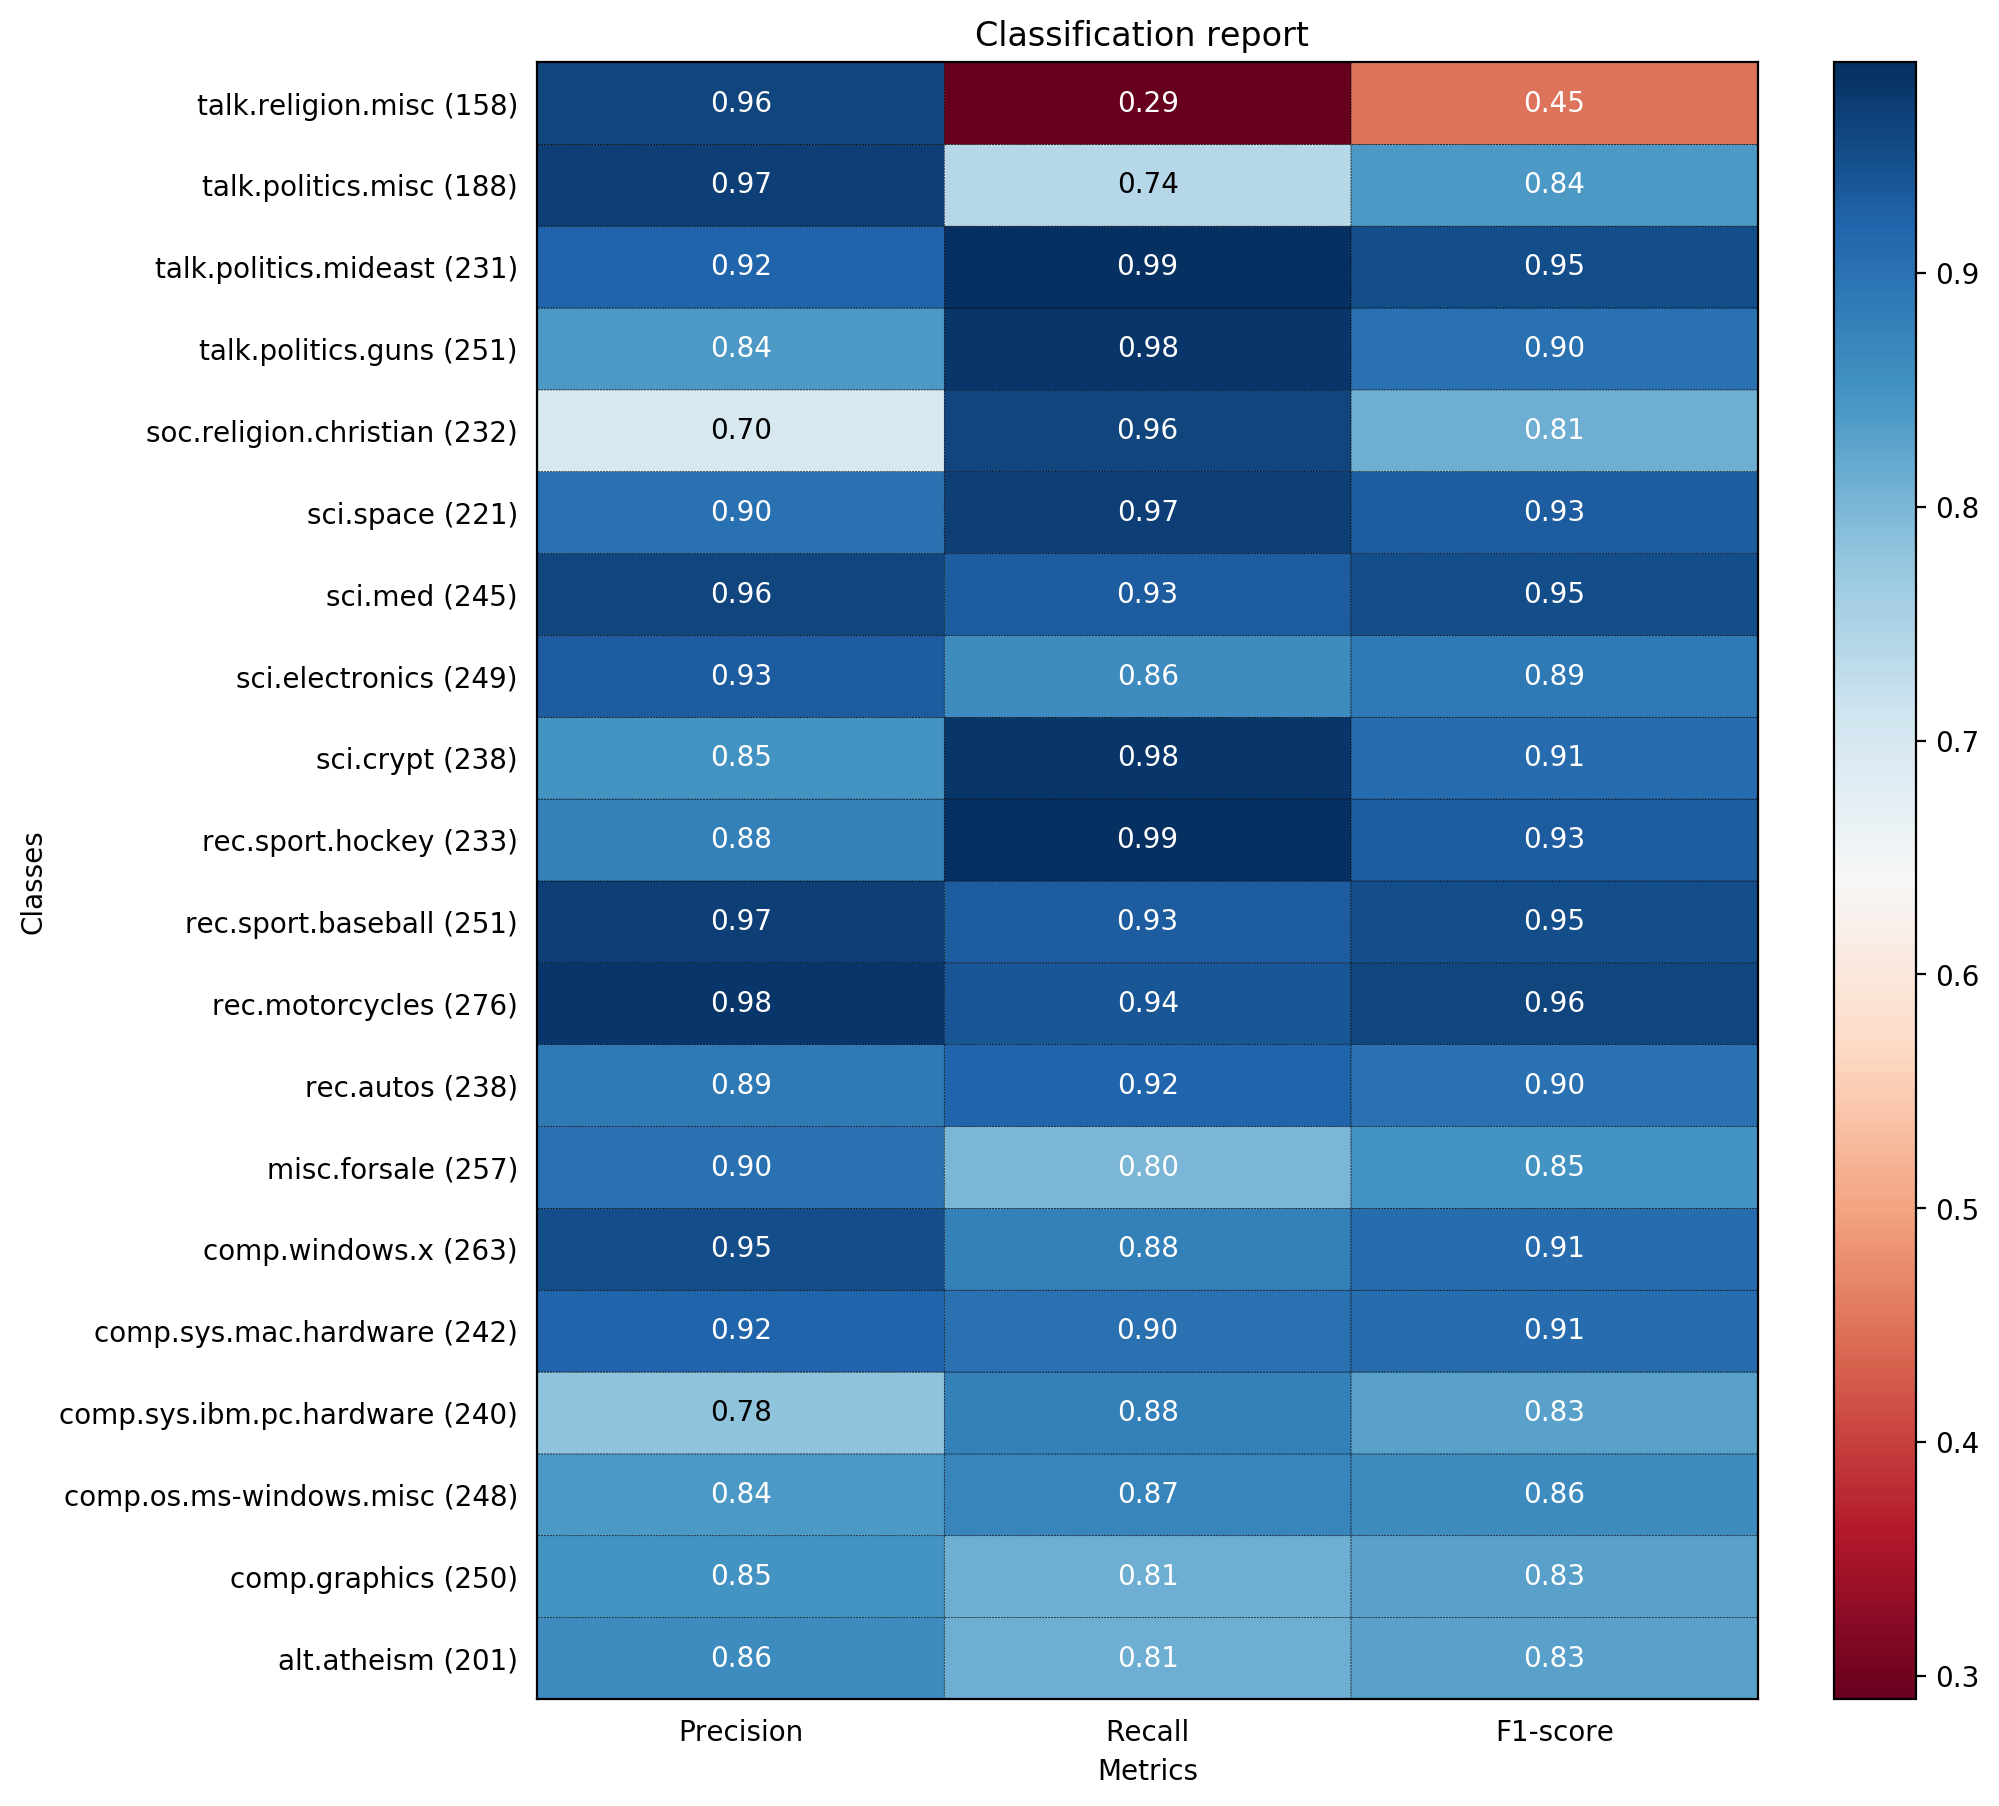
alt.atheism 0.86 0.81 0.83 201
comp.graphics 0.85 0.81 0.83 250
comp.os.ms-windows.misc 0.84 0.87 0.86 248
comp.sys.ibm.pc.hardware 0.78 0.88 0.83 240
comp.sys.mac.hardware 0.92 0.90 0.91 242
comp.windows.x 0.95 0.88 0.91 263
misc.forsale 0.90 0.80 0.85 257
rec.autos 0.89 0.92 0.90 238
rec.motorcycles 0.98 0.94 0.96 276
rec.sport.baseball 0.97 0.93 0.95 251
rec.sport.hockey 0.88 0.99 0.93 233
sci.crypt 0.85 0.98 0.91 238
sci.electronics 0.93 0.86 0.89 249
sci.med 0.96 0.93 0.95 245
sci.space 0.90 0.97 0.93 221
soc.religion.christian 0.70 0.96 0.81 232
talk.politics.guns 0.84 0.98 0.90 251
talk.politics.mideast 0.92 0.99 0.95 231
talk.politics.misc 0.97 0.74 0.84 188
talk.religion.misc 0.96 0.29 0.45 158
avg / total 0.89 0.88 0.88 4712可视化性能对比图如下:


 1万+
1万+

 被折叠的 条评论
为什么被折叠?
被折叠的 条评论
为什么被折叠?
 到【灌水乐园】发言


