


引言
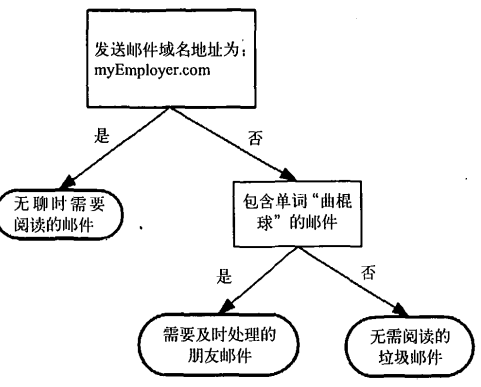
邮件分类系统:首先检测发送邮件域名地址,如果地址为MyEmployer.com则将其放在分类“无聊时需要阅读的邮件”中。如果邮件不是来自这个域名,则检查邮件内容里是否包含单词曲棍球,如果包含则将邮件归类到“需要及时处理的朋友邮件”,如果不包含则将邮件归类到“无需阅读的垃圾邮件”。
思路
(1)从一堆原始数据中构造决策树,首先我们讨论构造决策树的方法,编写构造树的python代码;
(2)度量算法成功率的方法;
(3)使用递归建立分类器,并使用Matplotlib绘制决策树图;
(4)输入一些隐性眼镜的处方数据,并由决策树分类器预测需要的镜片类型。
当决策树采用二分法划分数据时,决策树的大致结构如图所示:
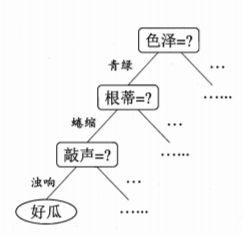
但是大部分时候,并不采用这种方法。如何选择最优划分属性,看划分能力有没有提升,故定义了一个信息增益。
信息增益
(在划分数据之前之后信息发现的变化称为信息增益)
简介
(1)划分数据集的最大原则:将无序的数据变得更加有序。
(2)好处:通过计算信息增益,计算每个特征值划分数据集获得的信息增益,获得信息增益最高的特征就是最好的划分。
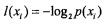
如何计算信息增益?
(1)度量方式称为为香农熵;
(2)
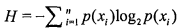
计算数据集的熵(信息熵):
# -*- coding: utf-8 -*-
__author__ = 'Mouse'
from math import log
def createDataSet():
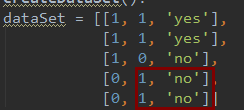
dataSet = [[1, 1, 'yes'],
[1, 1, 'yes'],
[1, 0, 'no'],
[0, 1, 'no'],
[0, 1, 'no']]
labels = ['no surfacing', 'flippers']
return dataSet, labels
def calcShannonEnt(dataSet):
numEntries = len(dataSet)
print "numEntries:", numEntries
labelCounts = {}
for featVec in dataSet: #the the number of unique elements and their occurance
currentLabel = featVec[-1] #取dataSet最后的一列数据
if currentLabel not in labelCounts.keys():labelCounts[currentLabel] = 0
labelCounts[currentLabel] += 1
print " labelCounts:",labelCounts # {'yes': 2, 'no': 3}
shannonEnt = 0.0
for key in labelCounts:
prob = float(labelCounts[key])/numEntries #如 yes: 2/5=0.4 如no :3/5=0.6
print key, ":", prob
shannonEnt -= prob * log(prob, 2) #log base 2
print key, ":", shannonEnt
return shannonEnt
if __name__ == '__main__':
dataSet, labels = createDataSet()
shannonEnt = calcShannonEnt(dataSet)
print shannonEnt
E:\Anaconda\python.exe E:/WorkSpace/py/algorithms/study/learn.py
numEntries: 5
 labelCounts: {'yes': 2, 'no': 3}
yes : 0.4
yes : 0.528771237955
no : 0.6
no : 0.970950594455
0.970950594455(正例子 yes+反例子no)numEntries: 6
labelCounts: {'maybe': 1, 'yes': 2, 'no': 3}
maybe : 0.166666666667
maybe : 0.430827083454
yes : 0.333333333333
yes : 0.959147917027
no : 0.5
no : 1.45914791703
1.45914791703 (正例子yes+反例子no)得到信息熵之后,就可以按照获取最大信息增益的方法划分数据集。
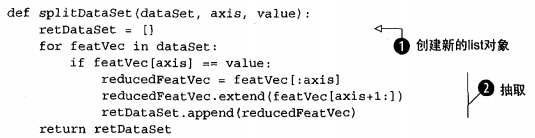
划分数据集
想象在一个二维空间的数据散点图,需要在数据之间画条线,将它们分成两个部分。
#dataSet是待划分的数据集、划分数据集的特征、特征的返回值
def splitDataSet(dataSet, axis, value):
    retDataSet = []
    for featVec in dataSet:
        if featVec[axis] == value: # 取出每行的第一个元素进行比较
            reducedFeatVec = featVec[:axis]     #chop out axis used for splitting
            reducedFeatVec.extend(featVec[axis+1:])
            retDataSet.append(reducedFeatVec)
    return retDataSet
retDataSet = splitDataSet(dataSet, 0, 0)
print retDataSet
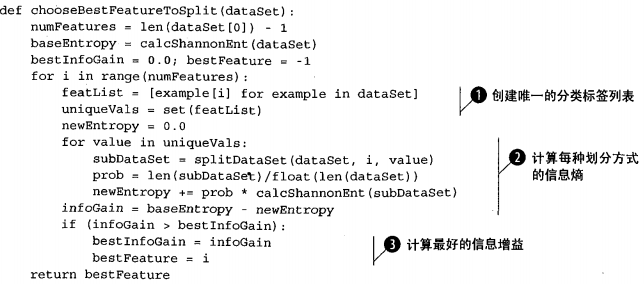
遍历整个数据集,循环计算机香农熵和splitDataSet()函数,找到最好的特征划分方式。熵的计算会告诉我们如何划分数据集是最好的数据组织方式。
就是指找到最好的信息增益,信息增益越大,对应的那个特征属性就是最好的划分。
构建决策树
使用Matplotlib注解绘制树形图。决策树的优点就是直观易于理解。
Matplotlib的使用方法:http://blog.csdn.net/ywjun0919/article/details/8692018
__author__ = 'Mouse'
import matplotlib.pyplot as plt

decisionNode = dict(boxstyle="sawtooth", fc="0.8")
leafNode = dict(boxstyle="round4", fc="0.8")
arrow_args = dict(arrowstyle="<-")


def getNumLeafs(myTree):
    numLeafs = 0
    firstStr = myTree.keys()[0]
    secondDict = myTree[firstStr]
    for key in secondDict.keys():
        if type(secondDict[
            key]).__name__ == 'dict':  # test to see if the nodes are dictonaires, if not they are leaf nodes
            numLeafs += getNumLeafs(secondDict[key])
        else:
            numLeafs += 1
    return numLeafs


def getTreeDepth(myTree):
    maxDepth = 0
    firstStr = myTree.keys()[0]
    secondDict = myTree[firstStr]
    for key in secondDict.keys():
        if type(secondDict[
            key]).__name__ == 'dict':  # test to see if the nodes are dictonaires, if not they are leaf nodes
            thisDepth = 1 + getTreeDepth(secondDict[key])
        else:
            thisDepth = 1
        if thisDepth > maxDepth: maxDepth = thisDepth
    return maxDepth


def plotNode(nodeTxt, centerPt, parentPt, nodeType):
    createPlot.ax1.annotate(nodeTxt, xy=parentPt, xycoords='axes fraction',
                            xytext=centerPt, textcoords='axes fraction',
                            va="center", ha="center", bbox=nodeType, arrowprops=arrow_args)


def plotMidText(cntrPt, parentPt, txtString):
    xMid = (parentPt[0] - cntrPt[0]) / 2.0 + cntrPt[0]
    yMid = (parentPt[1] - cnt
最低0.47元/天 解锁文章


 1043
1043

 被折叠的 条评论
为什么被折叠?
被折叠的 条评论
为什么被折叠?
 到【灌水乐园】发言


