


颁奖了
跳过的有
Remap_Demo.cpp
&
Geometric_Transforms_Demo.cpp
\tutorial_code\ImgTrans
重映射
把一个图像中一个位置的像素放置到另一个图片指定位置的过程.
仿射变换
一个任意的仿射变换都能表示为 乘以一个矩阵 (线性变换) 接着再 加上一个向量 (平移).
= =
有没有觉得之前做的像是在玩PS
【19】 直方图
calcHist_Demo.cpp
&
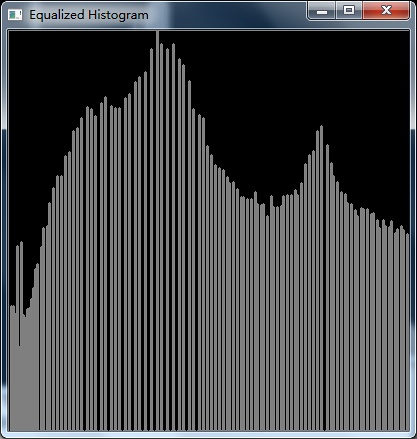
EqualizeHist_Demo.cpp
直方图是对数据的集合 统计 ,并将统计结果分布于一系列预定义的 bins 中。
直方图可以统计的不仅仅是颜色灰度, 它可以统计任何图像特征 (如 梯度, 方向等等)。
直方图的一些具体细节:
dims: 需要统计的特征的数目, 在上例中, dims = 1 因为我们仅仅统计了灰度值(灰度图像)。
bins: 每个特征空间 子区段 的数目,在上例中, bins = 16
range: 每个特征空间的取值范围,在上例中, range = [0,255]
OpenCV提供了一个简单的计算数组集(通常是图像或分割后的通道)的直方图函数 calcHist 。 支持高达 32 维的直方图。
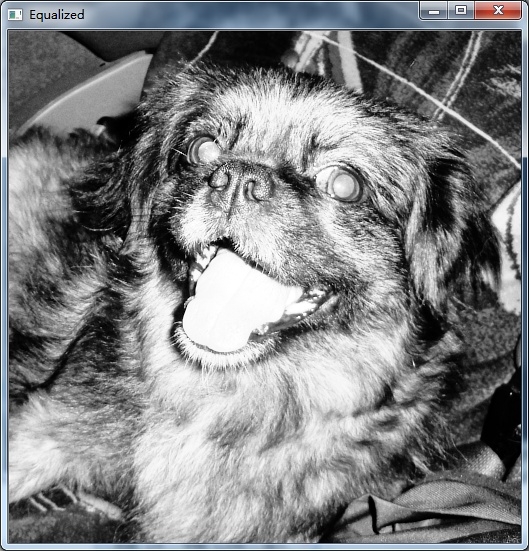
修改一下例程 ==
我们只做灰度 = =
,演示均衡化 = =
#include "opencv2/highgui/highgui.hpp"
#include "opencv2/imgproc/imgproc.hpp"
#include <iostream>
#include <stdio.h>
using namespace std;
using namespace cv;
int main( int argc, char** argv )
{
Mat src, src_grey,dst;
/// Load image
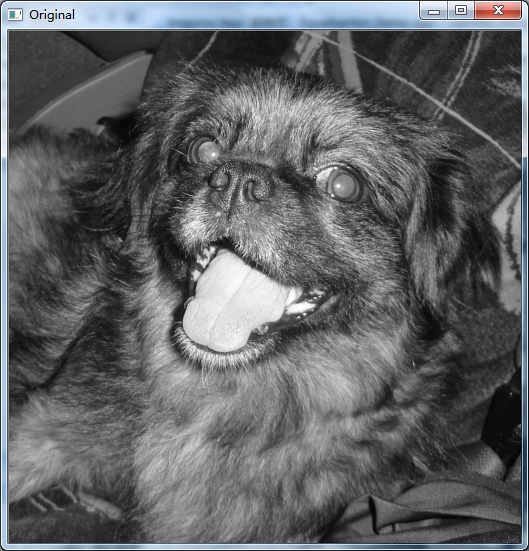
src = imread( "chicky_512.png", 1 );
if( !src.data )
{ return -1; }
cvtColor( src, src_grey, CV_BGR2GRAY );
/// 设定bins数目
int histSize = 255;
/// 设定像素值范围
float range[] = { 0, 255 } ;
const float* histRange = { range };
//我们要把bin范围设定成同样大小(均一)以及开始统计前先清除直方图中的痕迹:
bool uniform = true; bool accumulate = false;
//最后创建储存直方图的矩阵:
Mat grey_hist;
/// Compute the histograms:
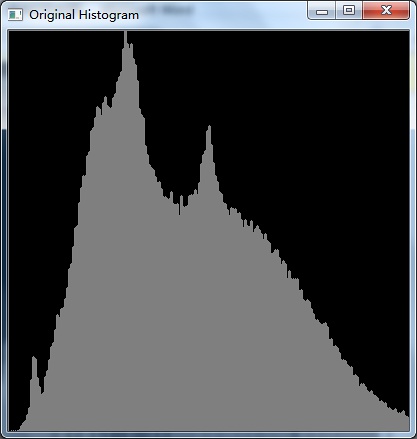
calcHist( &src_grey, 1, 0, Mat(), grey_hist, 1, &histSize, &histRange, uniform, accumulate );
// Draw the histograms for R, G and B
int hist_w = 400; int hist_h = 400;
int bin_w = cvRound( (double) hist_w/histSize );
Mat histImage( hist_w, hist_h, CV_8UC3, Scalar( 0,0,0) );
/// Normalize the result to [ 0, histImage.rows ]
normalize(grey_hist,grey_hist, 0, histImage.rows, NORM_MINMAX, -1, Mat() );
/// Draw for channel
for( int i = 1; i < histSize; i++ )
{
line( histImage, Point( bin_w*(i),hist_h) ,
Point( bin_w*(i), hist_h - cvRound(grey_hist.at<float>(i)) ),
Scalar( 127, 127, 127), 2, 8, 0 );
}
// Display
namedWindow("Histogram", CV_WINDOW_AUTOSIZE );
namedWindow("Original", CV_WINDOW_AUTOSIZE );
imshow("Original", src_grey );
imshow("Histogram", histImage );
waitKey(0);
return 0;
}
本来还想做一个直方图规定化的 = =


 1万+
1万+


 被折叠的 条评论
为什么被折叠?
被折叠的 条评论
为什么被折叠?
 到【灌水乐园】发言


