


0、ElasticSearch监控的指标
一、Elasticsearch_exporter
1.1 简介
选择grafana作为监控是因为它展示出来很漂亮,而且可下载到前人使用过的配置文件,能够快速的搭建起监控系统;选择elasticsearch_exporter是因为它与ES集群是分开独立的,不需要对原有的ES集群(可能有很多个)做任何修改,不需要重启,只要能访问es集群即可,非常方便。
1.2 安装过程
1.2.1 下载
下载链接:elasticsearch_exporter,下载版本:elasticsearch_exporter-1.3.0.linux-amd64.tar.gz
1.2.2 安装启动
上传elasticsearch_exporter-1.3.0.linux-amd64.tar.gz文件到/data/software目录,解压:
tar -xvf elasticsearch_exporter-1.3.0.linux-amd64.tar.gz
cd elasticsearch_exporter-1.3.0.linux-amd64/前台启动(默认监听端口9114):
./elasticsearch_exporter --web.listen-address=":9114" --es.uri http://172.20.32.218:9200 后台启动:
nohup ./elasticsearch_exporter --web.listen-address=":9114" --es.uri http://172.20.32.218:9200 & 完整参数启动:
nohup ./elasticsearch_exporter --es.all --es.indices --es.cluster_settings --es.indices_settings --es.shards --es.snapshots --es.timeout=10s --web.listen-address=":9114" --web.telemetry-path="/metrics" --es.uri http://172.20.32.218:9200 &注意:只要设置不同的-web.listen-address监听端口,可启动多个实例,分别监控不同的ES集群:
# es集群1:10.xxx.xxx.10:9200
nohup ./elasticsearch_exporter --es.all --es.indices --es.cluster_settings --es.indices_settings --es.shards --es.snapshots --es.timeout=10s --web.listen-address=":9114" --web.telemetry-path="/metrics" --es.uri http://10.xxx.xxx.10:9200 &

# es集群2:10.xxx.xxx.11:9200
nohup ./elasticsearch_exporter --es.all --es.indices --es.cluster_settings --es.indices_settings --es.shards --es.snapshots --es.timeout=10s --web.listen-address=":9115" --web.telemetry-path="/metrics" --es.uri http://10.xxx.xxx.11:9200 &
1.2.3 制定成系统服务(强烈推荐)
cat > /etc/systemd/system/elasticsearch_exporter.service << "EOF"
[Unit]
Description=elasticsearch_exporter
After=local-fs.target network-online.target network.target

[Service]
Type=simple
ExecStart=/usr/local/elasticsearch_exporter/elasticsearch_exporter \
         --es.all --es.indices --es.cluster_settings \
         --es.indices_settings --es.shards --es.snapshots \
         --es.timeout=10s --web.listen-address=0.0.0.0:9114 \
         --web.telemetry-path=/metrics \
         --es.uri http://172.20.32.218:9200
ExecReload=/bin/kill -HUP $MAINPID
KillMode=process
Restart=on-failure

[Install]
WantedBy=multi-user.target
EOF
systemctl daemon-reload
systemctl enable elasticsearch_exporter
systemctl start elasticsearch_exporter
systemctl status elasticsearch_exporter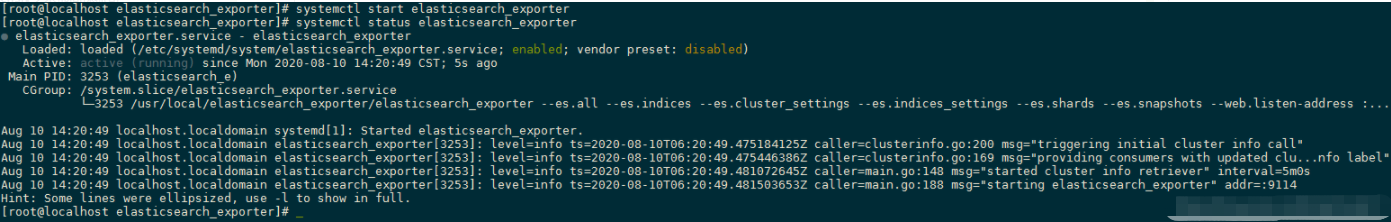
1.2.4.验证
可通过命令:tailf nohup.out 查看日志。
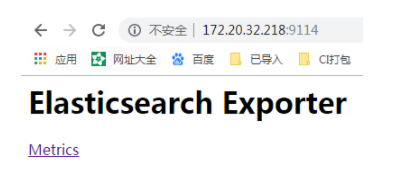
启动成功后,可以访问 curl "http://127.0.0.1:9114/metrics",看抓取的指标信息,或者浏览器访问
1.3 参数说明
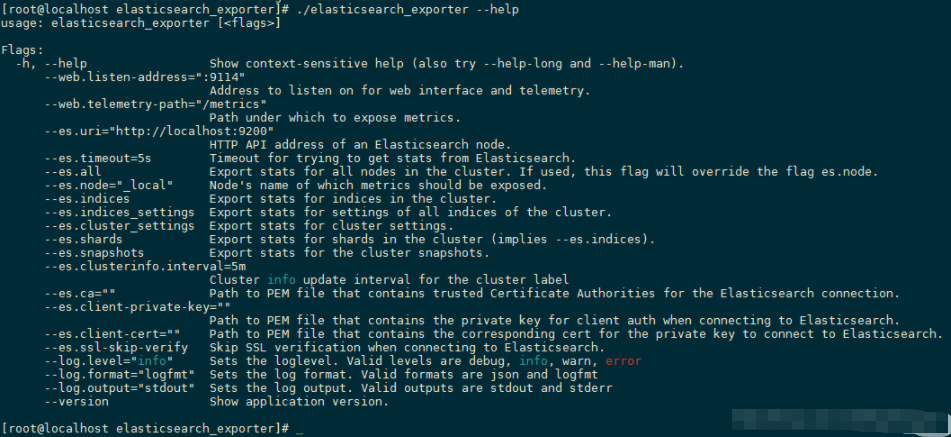
| 参数 | 参数说明 |
| --es.uri | 默认http://localhost:9200,连接到的Elasticsearch节点的地址(主机和端口)。 这可以是本地节点(例如localhost:9200),也可以是远程 Elasticsearch服务器的地址 |
| --es.all | 默认flase,如果为true,则查询群集中所有节点的统计信息,而不仅仅是查询我们连接到的节点。 |
| --es.cluster_settings | 默认flase,如果为true,请在统计信息中查询集群设置 |
| --es.indices | 默认flase,如果为true,则查询统计信息以获取集群中的所有索引。 |
--es.indices_settings | 默认flase,如果为true,则查询集群中所有索引的设置统计信息。 |
| --es.shards |
默认flase,如果为true,则查询集群中所有索引的统计信息,包括分片级统计信息(意味着es.indices = true)。
|
| --es.snapshots | 默认flase,如果为true,则查询集群快照的统计信息。 |
二、修改Prometheus配置
1.进入prometheus安装目录,编辑prometheus.yml
# vim prometheus.yml //加入prometheus监控中,targets可配置多个监控目标
  - job_name: 'elasticsearch'
    scrape_interval: 60s
    scrape_timeout:  30s
    metrics_path: "/metrics"
    static_configs:
    - targets: ['XXX.XXX.XXX.XXX:9114']
2.重启Prometheus
浏览器查看监控信息:http://localhost:9090/targets
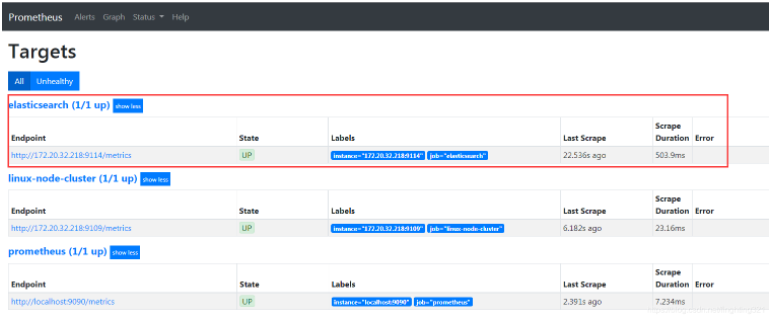
注:State=UP,说明成功
三、Grafana配置
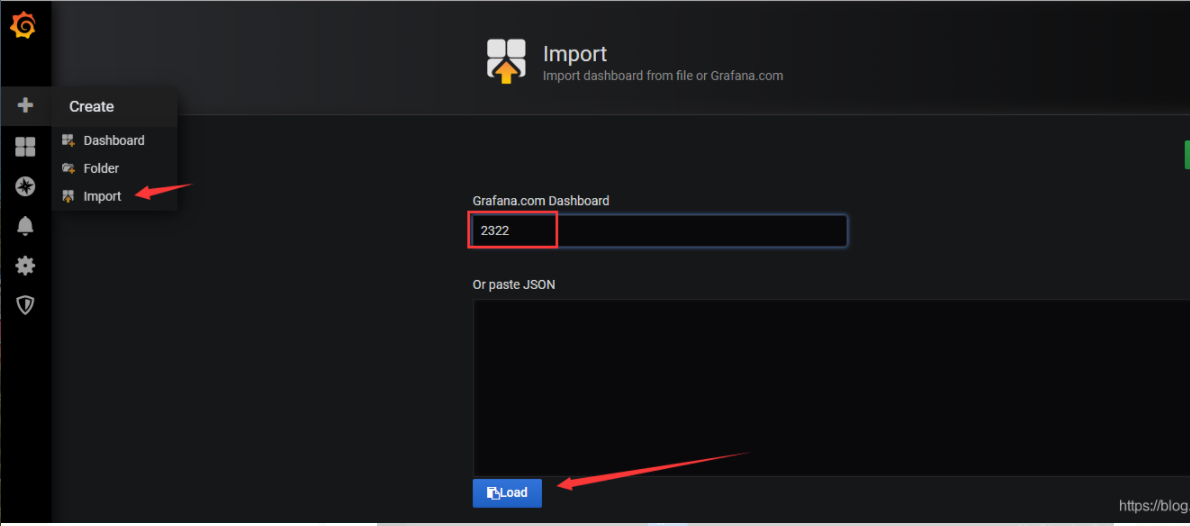
浏览器访问:http://localhost:3000,导入官方模板
模板推荐:以下挑选一款模板使用就可以了
①官方模板:编号为2322
②个人使用觉得比较好:
13071: Dashboard for Elasticsearch Cluster Stats13073: Dashboard for Elasticsearch Node Stats13072: Dashboard for Elasticsearch Index Stats13074: Dashboard for Elasticsearch History Stats
修改模板信息Prometheus
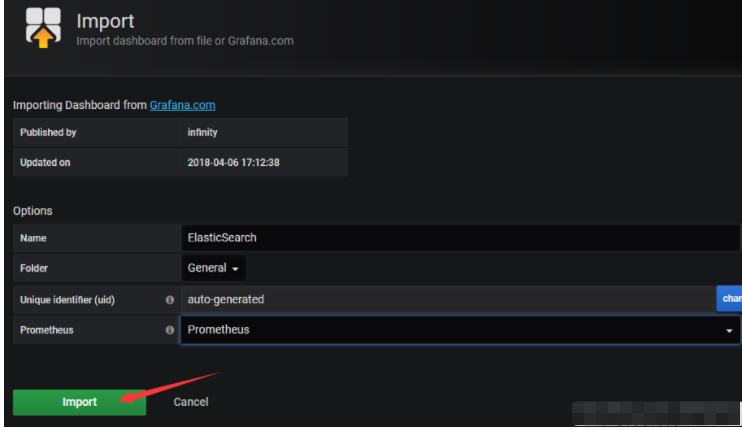
配置完之后,查看仪表盘,就能自动读取prometheus存储的数据
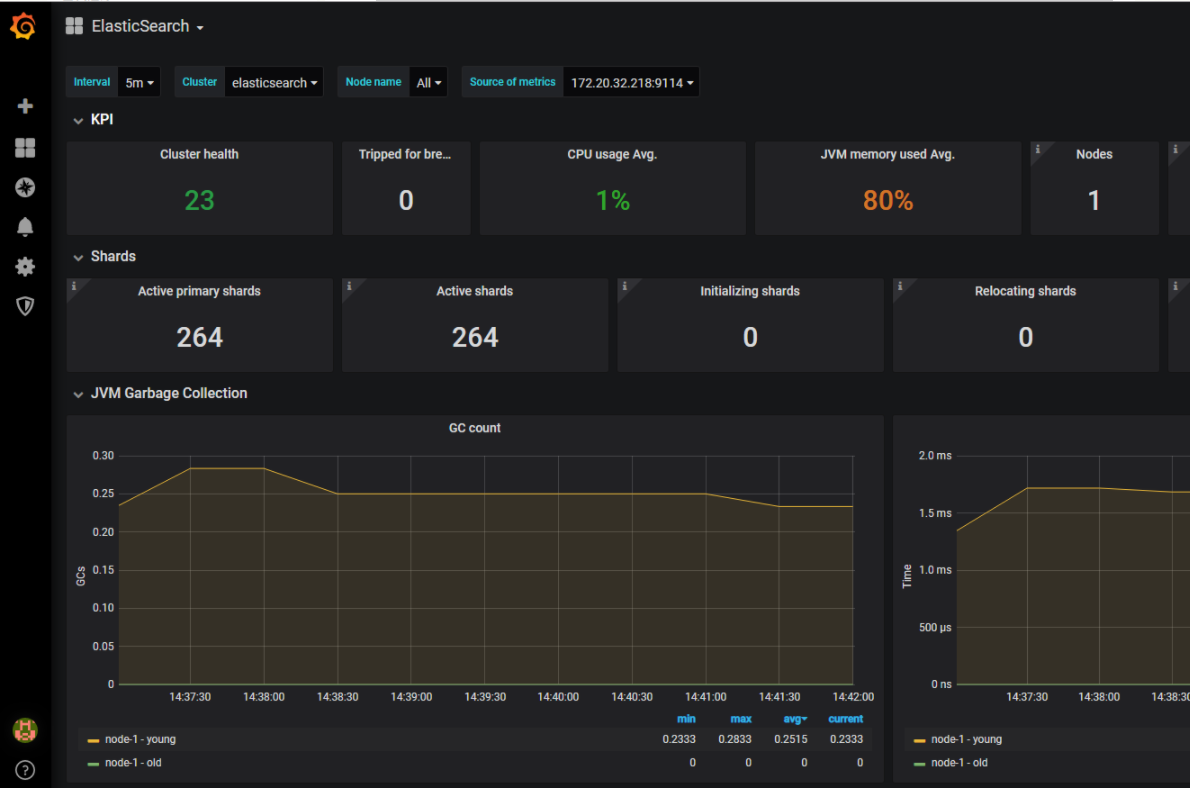
3.1 监控的指标说明
具体监控的指标解释:Metrics


 3144
3144


 被折叠的 条评论
为什么被折叠?
被折叠的 条评论
为什么被折叠?
 到【灌水乐园】发言


