


SurfaceFlinger
SurfaceFlinger 是 Android 的一个服务,运行在 Android 的System 进程中,负责管理系统的帧缓冲区,绘制应用程序的UI。Android应用程序会请求
SurfaceFlinger 是 Android 的一个服务,运行在 Android 的System 进程中,负责管理系统的帧缓冲区,绘制应用程序的UI。Android应用程序会请求
清空缓存
$ adb shell dumpsys SurfaceFlinger –latency-clear
[void android::SurfaceFlinger::setMTKProperties(android::String8&)]
====================================================
[AOSP part]
debug.sf.showupdates (mDebugRegion): 0
debug.sf.ddms (mDebugDDMS): 0
[MTK SF part]
debug.sf.busyswap (mBusySwap): 0
debug.sf.log_repaint (mLogRepaint): 0
debug.sf.log_buffer (mLogBuffer): 0
debug.sf.line_g3d (mLineG3D): 0
debug.sf.line_ss (mLineScreenShot): 0
debug.sf.dump_ss (mDumpScreenShot): 0
debug.sf.slowmotion (mDelayTime): 0
debug.sf.contbufsenable (mContBufsDump): 0
[MTK GUI part]
debug.bq.line: 0
debug.st.line: 0
[MTK HWC part]
debug.sf.line_ovl: 0
debug.sf.debug_oex: 0
==========================================
获取可视窗口列表
$ adb shell dumpsys SurfaceFlinger –list
[void android::SurfaceFlinger::setMTKProperties(android::String8&)]
===========================================
[AOSP part]
debug.sf.showupdates (mDebugRegion): 0
debug.sf.ddms (mDebugDDMS): 0
[MTK SF part]
debug.sf.busyswap (mBusySwap): 0
debug.sf.log_repaint (mLogRepaint): 0
debug.sf.log_buffer (mLogBuffer): 0
debug.sf.line_g3d (mLineG3D): 0
debug.sf.line_ss (mLineScreenShot): 0
debug.sf.dump_ss (mDumpScreenShot): 0
debug.sf.slowmotion (mDelayTime): 0
debug.sf.contbufsenable (mContBufsDump): 0
[MTK GUI part]
debug.bq.line: 0
debug.st.line: 0
[MTK HWC part]
debug.sf.line_ovl: 0
debug.sf.debug_oex: 0
DimSurface
com.android.systemui.ImageWallpaper
com.tmall.wireless/com.tmall.wireless.maintab.module.TMMainTabActivity
com.tmall.wireless/com.tmall.wireless.module.category.TMNewCategoryActivity
com.tmall.wireless/com.tmall.wireless.module.search.searchResult.TMSearchResultActivity
DimAnimator
StatusBar
越下面的窗口,越在上层。如我要找天猫打开的Activity, 就取得包名为 com.tmall.wireless 的最后一条数据 xxx.TMSearchResultActivity
获取窗口的帧延时数据
$ adb shell dumpsys SurfaceFlinger –latency com.tmall.wireless/com.tmall.wireless.module.search.searchResult.TMSearchResultActivity
[void android::SurfaceFlinger::setMTKProperties(android::String8&)]
====================================================
[AOSP part]
debug.sf.showupdates (mDebugRegion): 0
debug.sf.ddms (mDebugDDMS): 0
[MTK SF part]
debug.sf.busyswap (mBusySwap): 0
debug.sf.log_repaint (mLogRepaint): 0
debug.sf.log_buffer (mLogBuffer): 0
debug.sf.line_g3d (mLineG3D): 0
debug.sf.line_ss (mLineScreenShot): 0
debug.sf.dump_ss (mDumpScreenShot): 0
debug.sf.slowmotion (mDelayTime): 0
debug.sf.contbufsenable (mContBufsDump): 0
[MTK GUI part]
debug.bq.line: 0
debug.st.line: 0
[MTK HWC part]
debug.sf.line_ovl: 0
debug.sf.debug_oex: 0
=============================
17340038
1812193316205 1812209665589 1812210614128
1812212222282 1812227121282 1812227918128
1812239753051 1812261917205 1812262521667
1812273201051 1812296490820 1812297217743
…
…
1815880321744 1815896512436 1815897669128
1815897796051 1815913973205 1815915028282
1815915093359 1815931327974 1815932468974
1815933351974 1815948728436 1815949869743
latency 帧率数据说明
说明:
刷新频率: 17340038
1 18121933162051812209665589 1812210614128
2 18122122222821812227121282 1812227918128
3 18122397530511812261917205 1812262521667
…
…
127 18159150933591815931327974 1815932468974
128 18159333519741815948728436 1815949869743
The first line currently contains the refresh period in nanosecond.
第一行是刷新频率,后面有128行,每行3个时间戳。
Each 128 following line contains 3 timestamps, of respectively the app draw time , the vsync timestamp just prior the call to set and the timestamp of the call to set.
在 /Users/army/JavaDev/adt_20140702/sdk/sources/android-xx/com/android/uiautomator/platform/SurfaceFlingerHelper.java 中包含 frame rate 的计算方法:
/**
* Calculate frame rate
* @return
*/
public static double getFrameRate() {
if (mRefreshPeriod < 0) {
log(Run command + FRAME_LATENCY_CMD + before calcuating average frame rate);
return -1.0;
}
if (mFrameBufferData.get(0) == null) {
log(Run command + FRAME_LATENCY_CMD + before retrieving frame buffer data);
return -1.0;
}
long startTime = Long.parseLong(mFrameBufferData.get(0).get(1));
long endTime = Long.parseLong(mFrameBufferData.get(mFrameLatencySampleSize - 1).get(1));
long totalDuration = endTime - startTime;
return (double)((mFrameLatencySampleSize - 1) * Math.pow(10, 9))/totalDuration;
}
dumpsys gfxinfo
在开发者选项中有个“ GPU呈现模式分析(Profile GPU rendering,计算adb shell dumpsys gfxinfo中的呈现时间)”功能,在开启这个功能后,系统就会记录保留每个界面最后128帧图像绘制的相关时间信息。在开启这个功能后,重新启动APP,滑动页面然后执行adb命令。
$ adb shell dumpsys gfxinfo com.tmall.wireless
Applications Graphics Acceleration Info:
Uptime: 386315 Realtime: 386308
* Graphics info for pid 4887 [com.tmall.wireless] *
Recent DisplayList operations
ClipRect
DrawText
RestoreToCount
RestoreToCount
DrawPatch
RestoreToCount
DrawRect
DrawPath
DrawBitmap
DrawText
…
multiDraw
DrawText
DrawPatch
DrawBitmap
DrawBitmapRect
DrawRect
DrawOval
…
multiDraw
DrawText
DrawPatch
Caches:
Current memory usage / total memory usage (bytes):
TextureCache 15078192 / 25165824
LayerCache 311296 / 16777216
RenderBufferCache 0 / 2097152
GradientCache 4096 / 524288
PathCache 1781076 / 10485760
TextDropShadowCache 0 / 2097152
FontRenderer 0 524288 / 524288
Other:
FboCache 1 / 16
PatchCache 3 / 512
Total memory usage:
17698948 bytes, 16.88 MB
Profile data in ms:
com.tmall.wireless/com.tmall.wireless.module.search.searchResult.TMSearchResultActivity/android.view.ViewRootImpl@42f81df0
Draw ProcessExecute
1.11 2.490.43
1.26 2.890.63
1.85 4.620.65
1.72 4.163.56
1.88 3.150.46
2.67 2.680.45
1.22 2.670.58
1.22 2.810.42
1.74 2.250.38
102.77 10.32 0.52
2.48 5.480.53
2.19 4.990.56
2.10 4.770.50
1.10 2.550.40
2.26 4.040.47
…
View hierarchy:
com.tmall.wireless/com.tmall.wireless.maintab.module.TMMainTabActivity/android.view.ViewRootImpl@42d08ee8
138 views, 62.20 kB of display lists, 1637 frames rendered
com.tmall.wireless/com.tmall.wireless.module.search.searchResult.TMSearchResultActivity/android.view.ViewRootImpl@42f81df0
420 views, 82.98 kB of display lists, 862 frames rendered
Total ViewRootImpl: 2
Total Views: 558
Total DisplayList: 145.18 kB
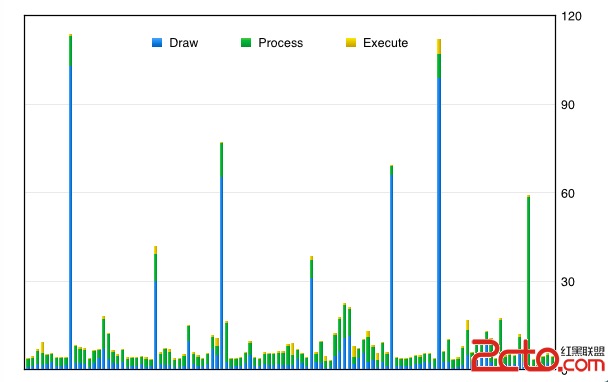
Draw:表示在Java中创建显示列表部分中,OnDraw()方法占用的时间。
Process:表示渲染引擎执行显示列表所花的时间,view越多,时间就越长
Execute:表示把一帧数据发送到屏幕上排版显示实际花费的时间。其实是实际显示帧数据的后台缓存区与前台缓冲区交换后并将前台缓冲区的内容显示到屏幕上的时间。
Draw + Process + Execute = 完整显示一帧 ,这个时间要小于16ms才能保存每秒60帧。
取得数据后,复制到excel中生成堆积柱状图.
图中可以清晰的看出在滑动时,耗时明显有很多帧超过16ms。这些都是需要结合操作进行优化的。


 4996
4996


 被折叠的 条评论
为什么被折叠?
被折叠的 条评论
为什么被折叠?
 到【灌水乐园】发言


