


- Stakeholders outside of the data science team may have little patience for details, and will often want a higher-level, more intuitive view of model performance.
- It is important for the data scientist to realize that clear communication with key stakeholders is not only a primary goal of her job, but also is essential for doing the right modeling (in addition to doing the modeling right).
————————————————————————————————————————————————
主要内容:
- Profit curves
- ROC graph (receiver operating characteristic)
- AUC graph (The area under the ROC Curve)
- Cumulative response and lift curve
————————————————————————————————————————————————
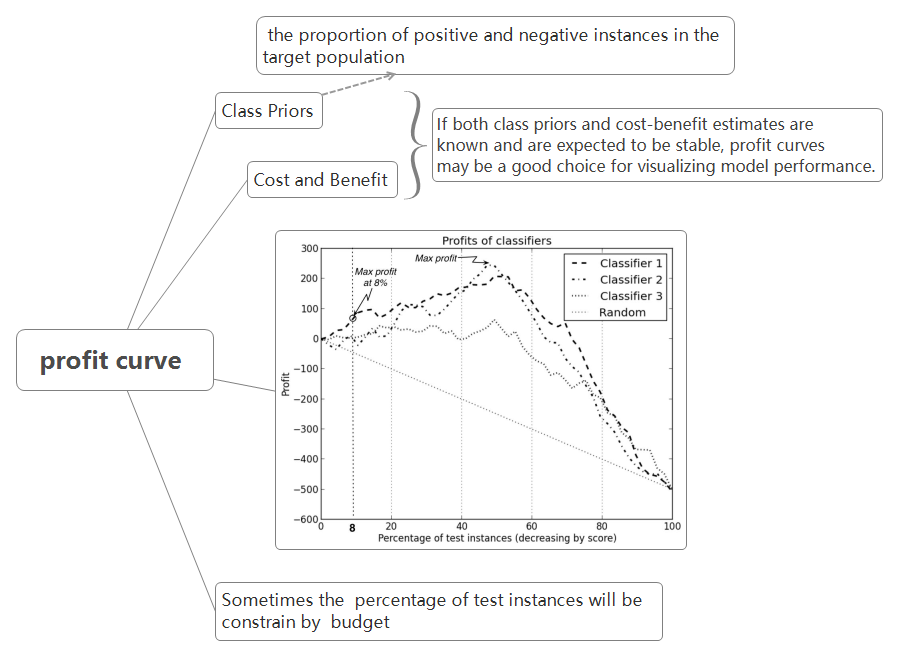
(一)Profit curve
The disadvantage of a profit graph is that it requires that operating conditions be known and specified exactly. With many real-world problems, the operating conditions are imprecise or change over time, and the data scientist must contend with uncertainty.
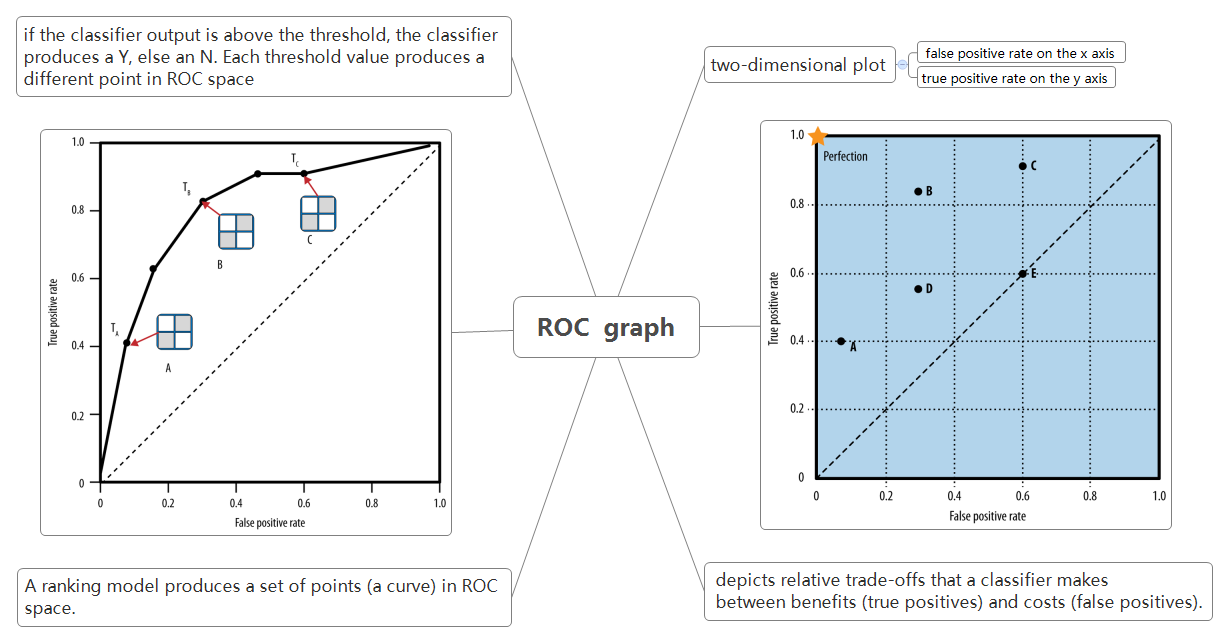
(二)ROC graph
在先验分布和损益不清楚的情况下,我们可以依据不同情况依次建立模型绘制Profit graph,但这显然不能让人满意
为解决这个问题,我们可以将各种情况的模型表现都绘制在一张图中,其中一种方法便是 Receiver Operating Characteristics (ROC) graph
ROC graph 的详细产生过程见下图
ROC数据点的计算方式
Confusion Matrix
P
N
Y
a
b
N
c
d
ROC Point
An advantage of ROC graphs is that they decouple classifier performance from the conditions under which the classifiers will be used. Specifically, they are independent of the class proportions as well as the costs and benefits.
The area under the RCO curve (AUC)
- Though a ROC curve provides more information than its area, the AUC is useful when a single number is needed to summarize performance, or when nothing is known about the operating conditions.
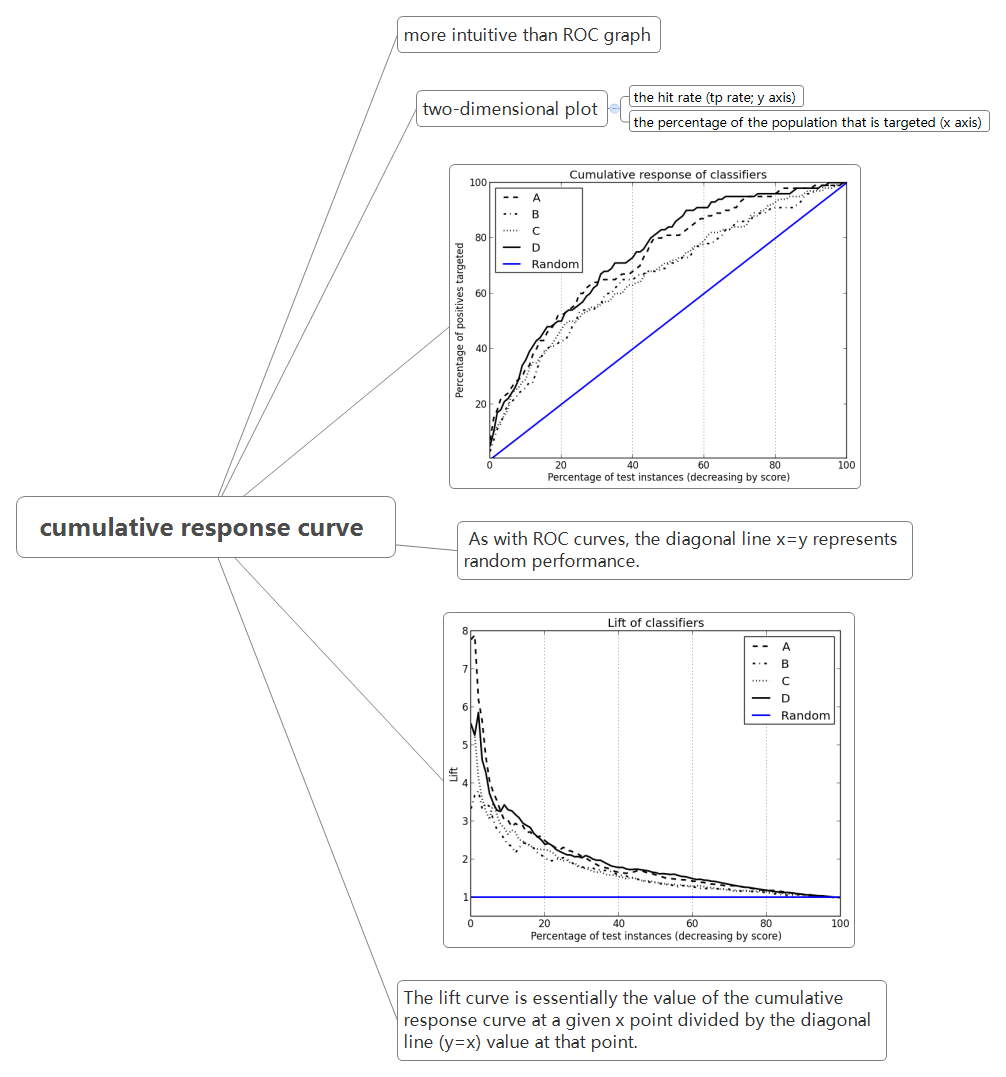
(三)Cumulative response and lift curve
(可视化模型表现)Visualizing Model Performance
最新推荐文章于 2025-09-30 23:27:56 发布


 526
526

 被折叠的 条评论
为什么被折叠?
被折叠的 条评论
为什么被折叠?
 到【灌水乐园】发言


