


棘状图可以由vcd包的spine()绘制;
library(vcd)
attach(Arthritis)
counts <- table(Treatment,Improved)
spine(counts,main = “Spinogram”)
detach(Arthritis)
图形:
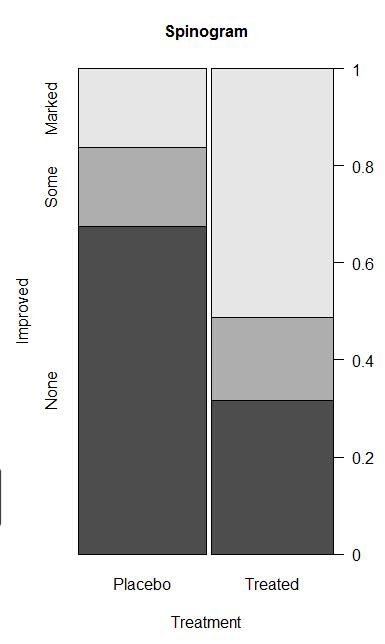
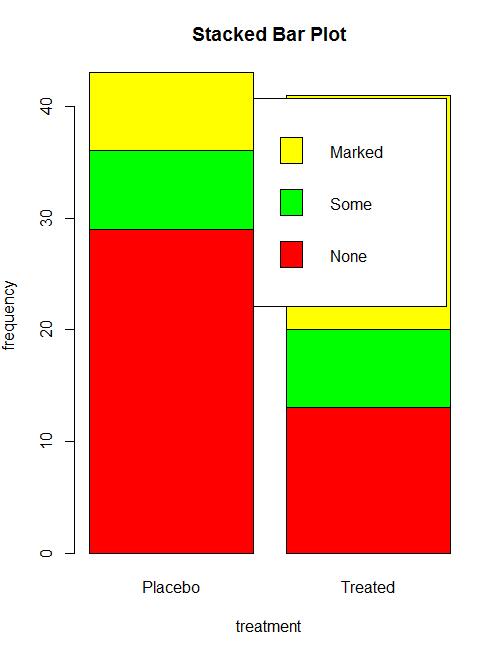
堆砌条形图是条形图的一种,与棘状图相比两者外貌比较相似,但是前者是实际频数,后者可看为百分比
attach(Arthritis)
counts <- table(Improved,Treatment)
barplot(counts,main=”Stacked Bar Plot”,xlab = “treatment”,ylab=”frequency”,col=c(“red”,”green”,”yellow”),legend=rownames(counts))
detach(Arthritis)’
图片:


 2132
2132


 被折叠的 条评论
为什么被折叠?
被折叠的 条评论
为什么被折叠?
 到【灌水乐园】发言


