


1. 简介
-
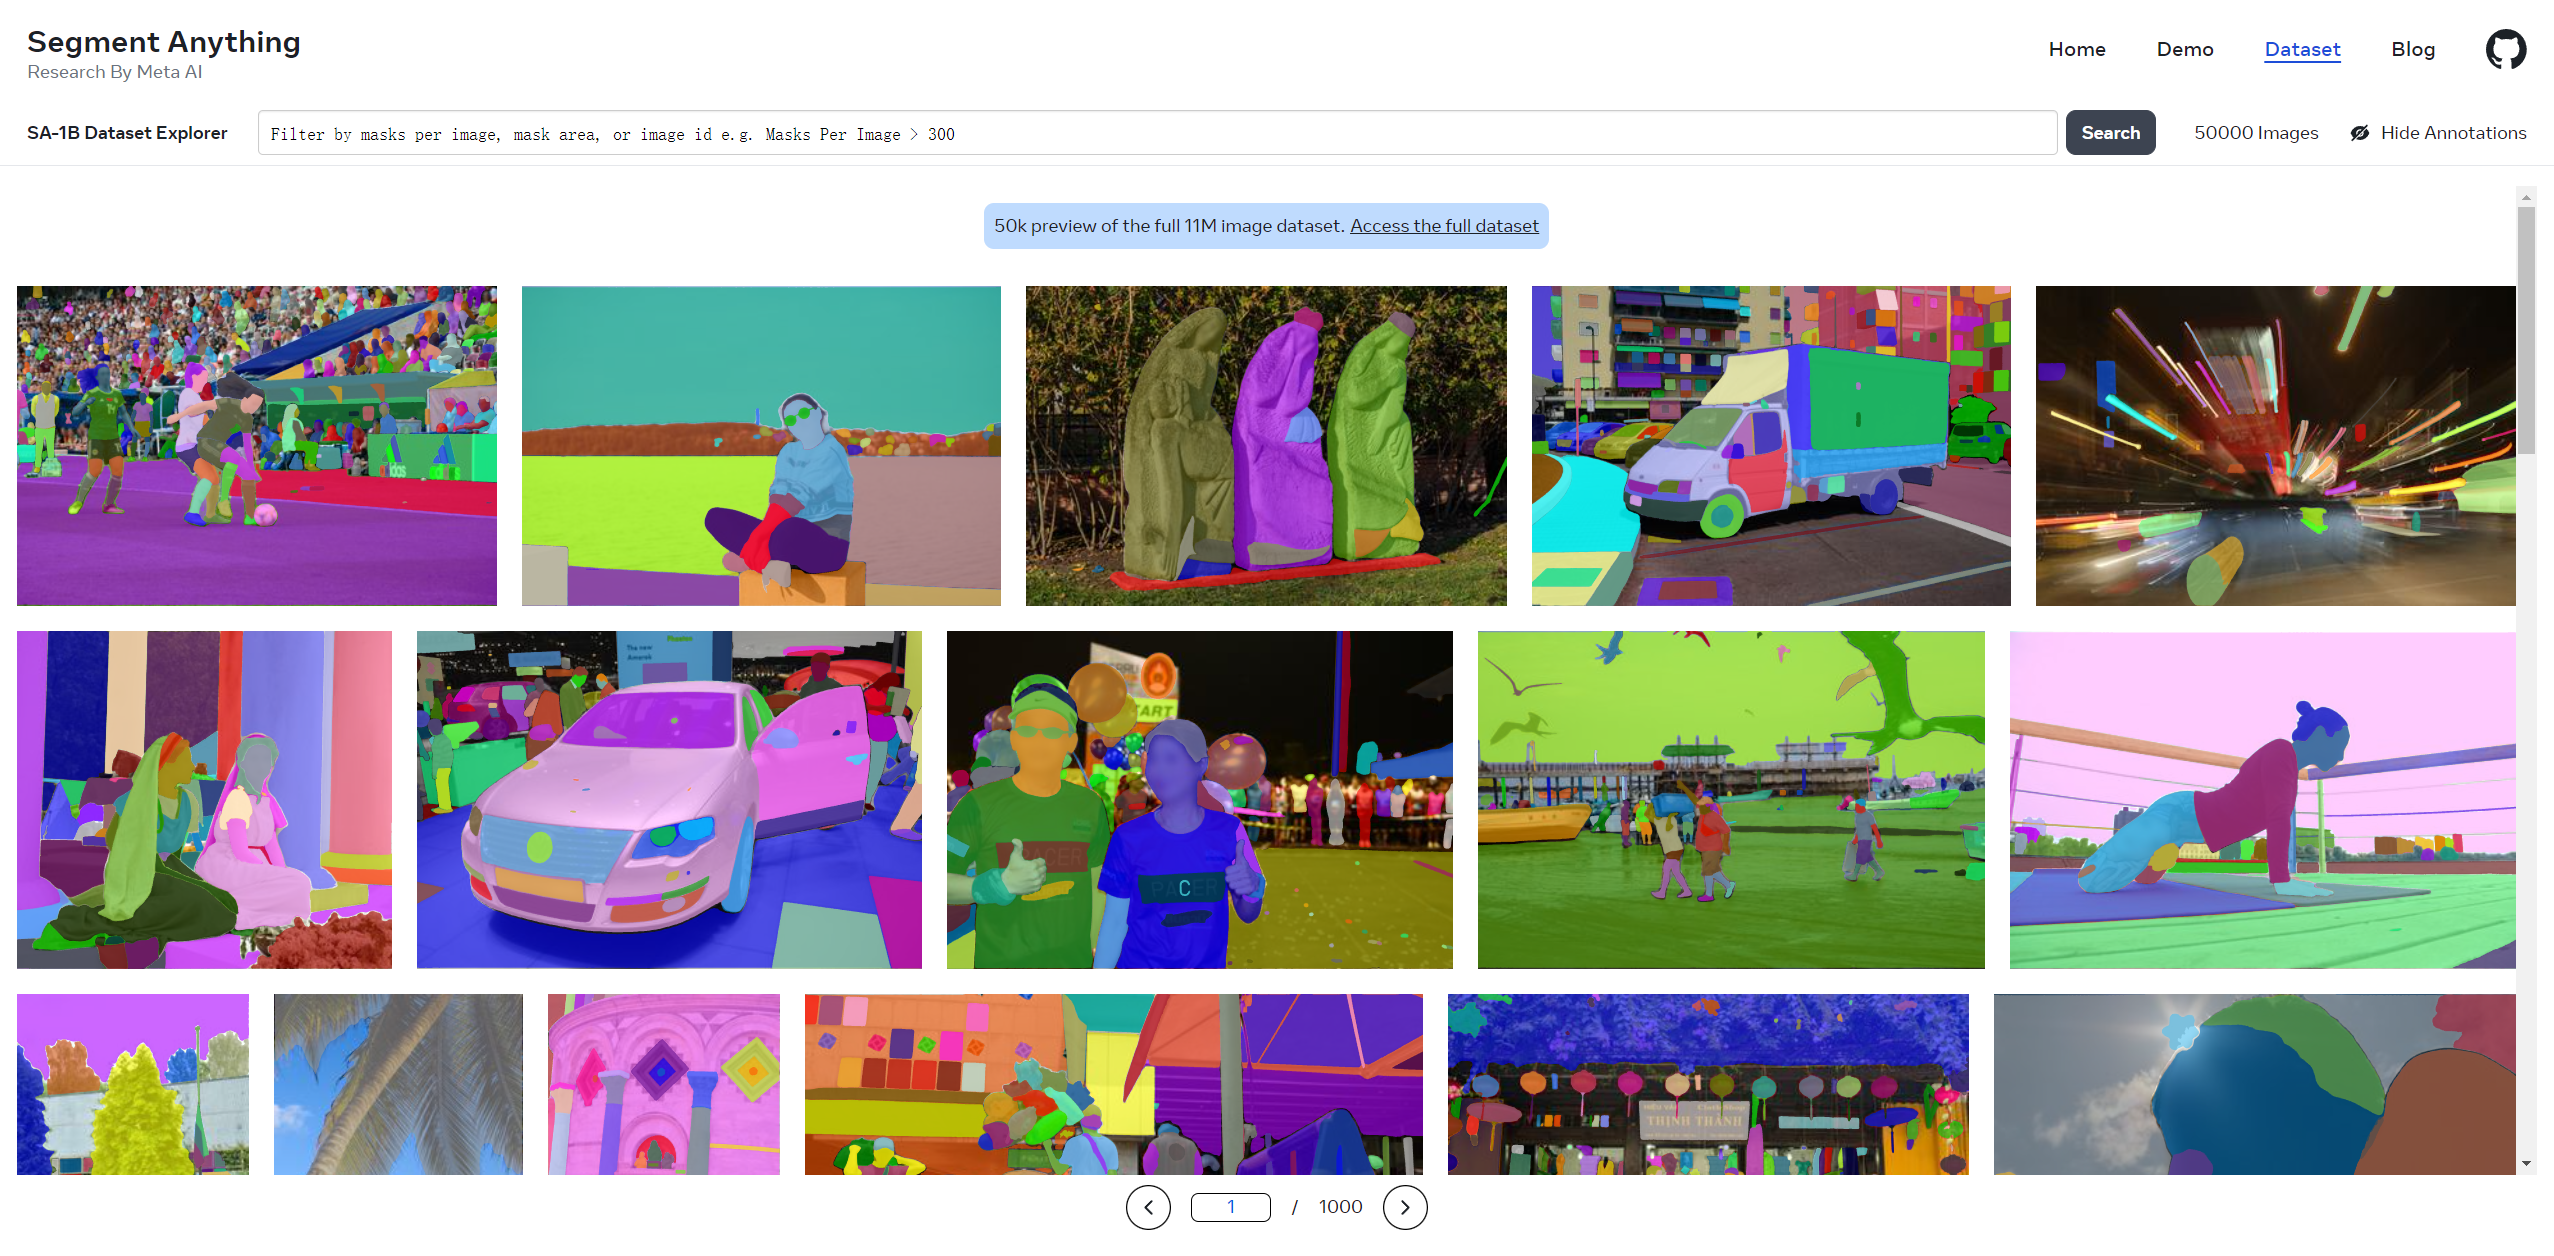
Segment Anything使用了11 million images and 1.1 billion masks 来进行训练
-
-
SAM与传统单纯的语义分割方式不同,加入了Prompt机制,可以将文字、坐标点、坐标框等作为辅助信息优化分割结果,
-
下载model checkpoint
2. 可选的模型类型
## default or vit_h: ViT-H SAM model.
vit_l: ViT-L SAM model.
vit_b: ViT-B SAM model.
3. 导入模型
## from segment_anything import sam_model_registry
sam = sam_model_registry["vit_h"](checkpoint="models/sam_vit_h_4b8939.pth")
- 这里需要注意,模型的名称需要用小写才行
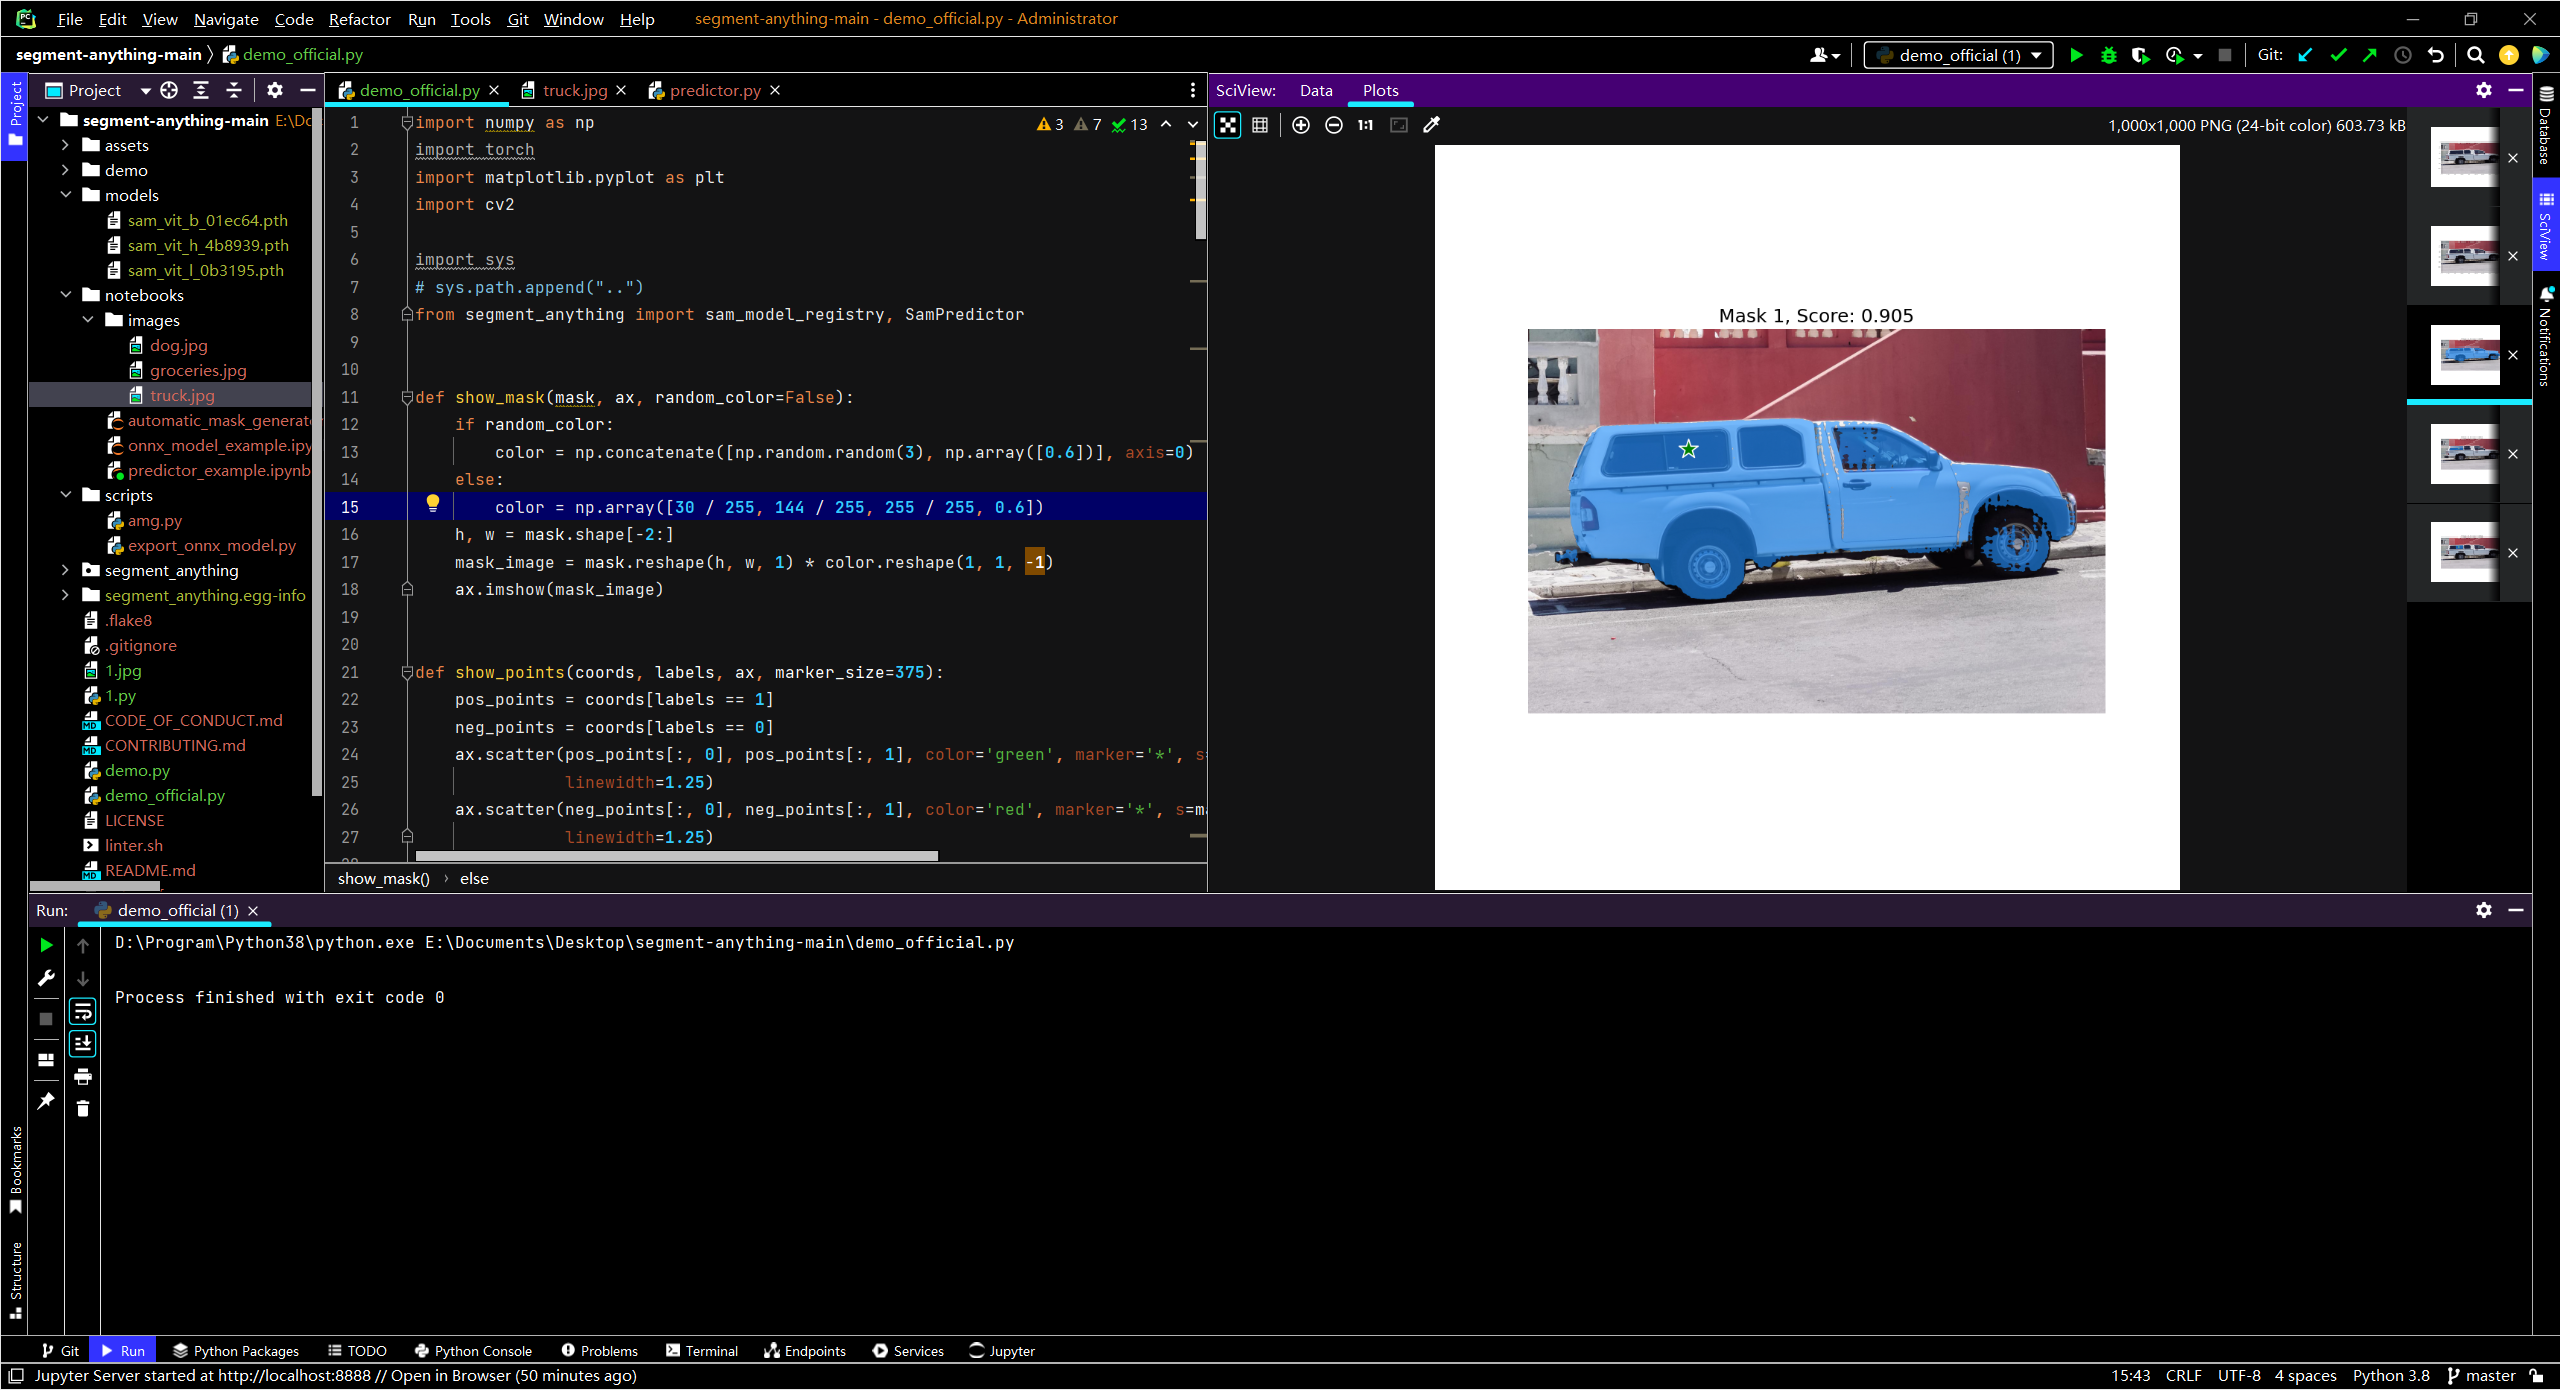
4. demo
代码
### import numpy as np
import torch
import matplotlib.pyplot as plt
import cv2


import sys
# sys.path.append("..")
from segment_anything import sam_model_registry, SamPredictor


def show_mask(mask, ax, random_color=False):
    if random_color:
        color = np.concatenate([np.random.random(3), np.array([0.6])], axis=0)
    else:
        color = np.array([30 / 255, 144 / 255, 255 / 255, 0.6])
    h, w = mask.shape[-2:]
    mask_image = mask.reshape(h, w, 1) * color.reshape(1, 1, -1)
    ax.imshow(mask_image)


def show_points(coords, labels, ax, marker_size=375):
    pos_points = coords[labels == 1]
    neg_points = coords[labels == 0]
    ax.scatter(pos_points[:, 0], pos_points[:, 1], color='green', marker='*', s=marker_size, edgecolor='white',
               linewidth=1.25)
    ax.scatter(neg_points[:, 0], neg_points[:, 1], color='red', marker='*', s=marker_size, edgecolor='white',
               linewidth=1.25)


def show_box(box, ax):
    x0, y0 = box[0], box[1]
    w, h = box[2] - box[0], box[3] - box[1]
    ax.add_patch(plt.Rectangle((x0, y0), w, h, edgecolor='green', facecolor=(0, 0, 0, 0), lw=2))


image = cv2.imread('notebooks/images/truck.jpg')
image = cv2.cvtColor(image, cv2.COLOR_BGR2RGB)

plt.figure(figsize=(10,10))
plt.imshow(image)
plt.axis('on')
plt.show()

sam_checkpoint = "models/sam_vit_b_01ec64.pth"
model_type = "vit_b"

device = "cuda"

sam = sam_model_registry[model_type](checkpoint=sam_checkpoint)
sam.to(device=device)

predictor = SamPredictor(sam)

input_point = np.array([[500, 375]])
input_label = np.array([1])

plt.figure(figsize=(10,10))
plt.imshow(image)
show_points(input_point, input_label, plt.gca())
plt.axis('on')
plt.show()

predictor.set_image(image)  # 设置要分割的图像

masks, scores, logits = predictor.predict(
    point_coords=input_point,
    point_labels=input_label,
    multimask_output=True,
)

for i, (mask, score) in enumerate(zip(masks, scores)):
    plt.figure(figsize=(10, 10))
    plt.imshow(image)
    show_mask(mask, plt.gca())
    show_points(input_point, input_label, plt.gca())
    plt.title(f"Mask {i + 1}, Score: {score:.3f}", fontsize=18)
    plt.axis('off')
    plt.show()


 2169
2169


 被折叠的 条评论
为什么被折叠?
被折叠的 条评论
为什么被折叠?
 到【灌水乐园】发言


