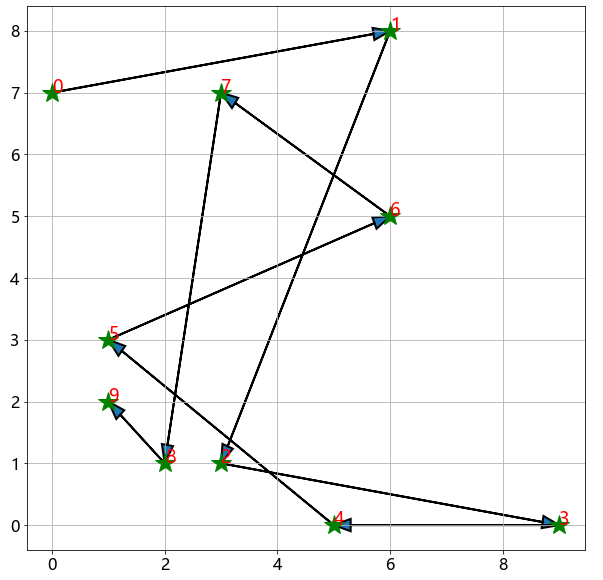
import matplotlib.pyplot as plt
import numpy
loc = np.random.randint(0,10,size = (10,2))
plt.figure(figsize=(10, 10))
plt.plot(loc[:,0], loc[:,1], 'g*', ms=20)
plt.grid(True)
way = np.arange(10)
np.random.shuffle(way)
for i in range(0, len(way)-1):
start = loc[way[i]]
end = loc[way[i+1]]
plt.arrow(start[0], start[1], end[0]-start[0], end[1]-start[1],
head_width=0.2, lw=2,
length_includes_head = True)
plt.text(start[0],start[1],s = i,fontsize = 18,color = 'red')
if i == len(way) - 2:
plt.text(end[0],end[1],s = i + 1,fontsize = 18,color = 'red')


 1750
1750

 被折叠的 条评论
为什么被折叠?
被折叠的 条评论
为什么被折叠?
 到【灌水乐园】发言


