


今天简单学习了一下怎么画箭头,感觉还是很有意思的
参考
https://stackoverflow.com/questions/43378730/how-to-get-an-open-and-scaling-arrow-head-in-matplotlib
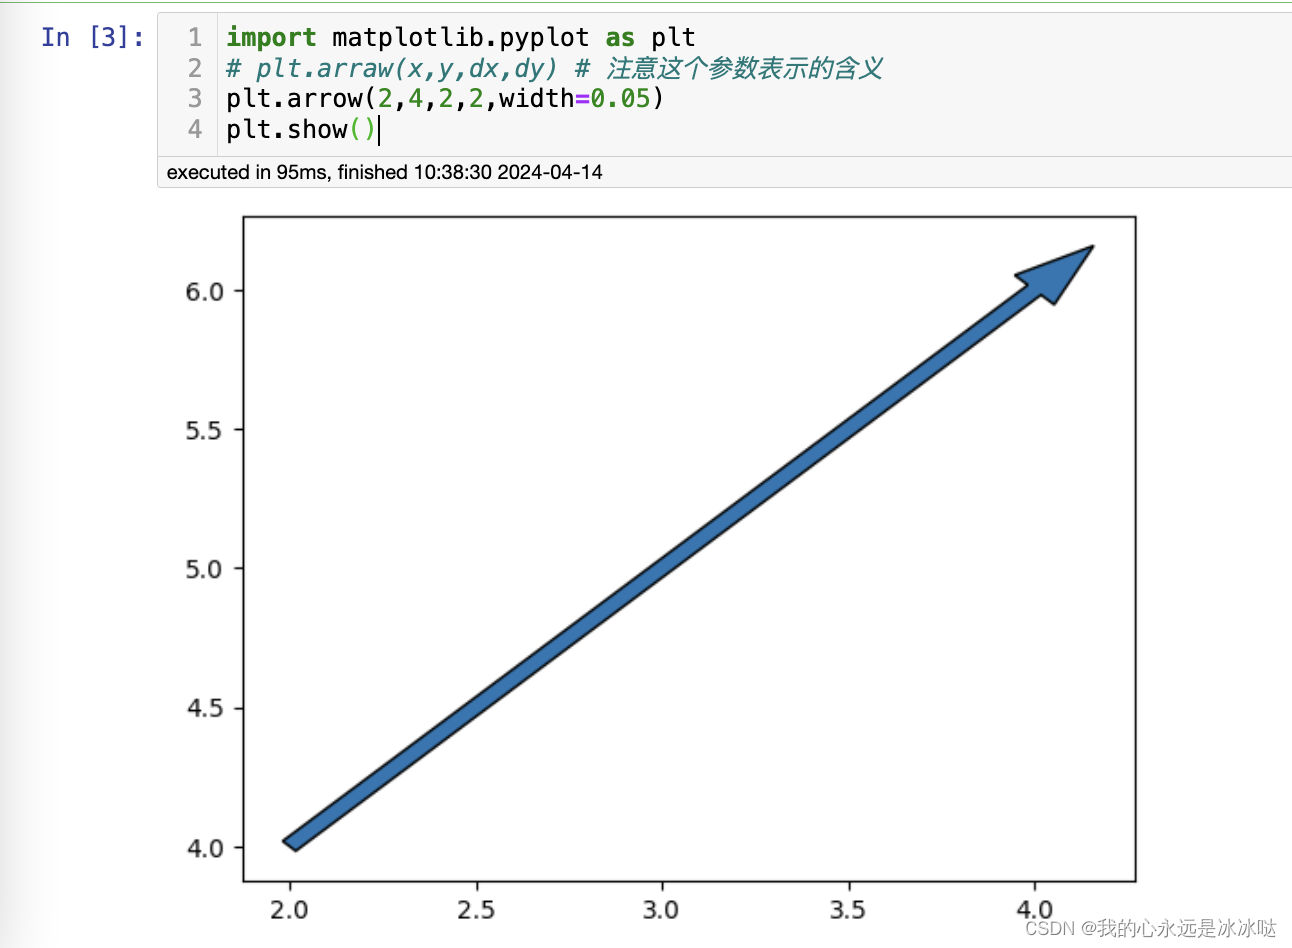
import matplotlib.pyplot as plt
# plt.arraw(x,y,dx,dy) # 注意这个参数表示的含义
plt.arrow(2,4,2,2,width=0.05)
plt.show()
结果如下
但这个ax.anotate也可以画箭头,但我还没学,有时间好好学一下
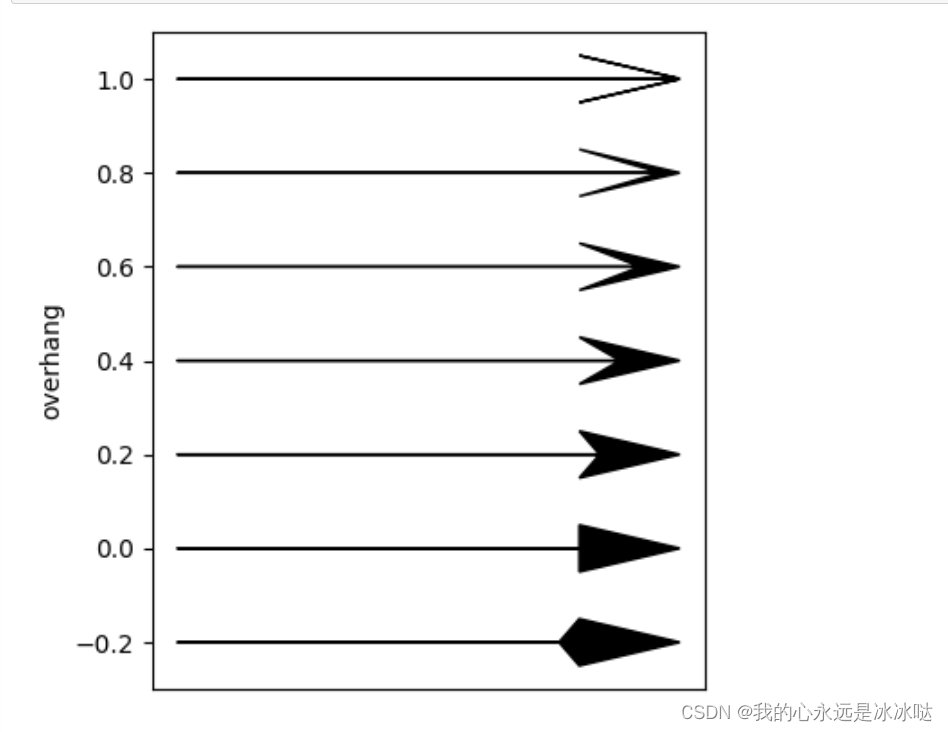
画不同的箭头的形状
import matplotlib.pyplot as plt

fig, ax = plt.subplots(figsize=(4,4))

v = [-0.2, 0, .2, .4, .6, .8, 1]
for i, overhang in enumerate(v):
    ax.arrow(.1,overhang,.6,0, width=0.001, color="k",
             head_width=0.1, head_length=0.15, overhang=overhang)

ax.set_yticks(v)
ax.set_xticks([])
ax.set_ylabel("overhang")
ax.set_ylim(-0.3,1.1)
plt.tight_layout()
plt.show()
画一个箭头
import matplotlib.pyplot as plt

fig, ax = plt.subplots(figsize=(4,4))
overhang = 1.0
ax.arrow(0,0,1.0,1.0, width=0.001, color="k",
         head_width=0.1, head_length=0.15, overhang=overhang)

#ax.add_line((0,0),(1,0))

ax.set_yticks([-0.2,0,0.4,0.8,1.0])
ax.set_xticks([-0.2,0,0.4,0.8,1.0])
ax.set_ylabel("overhang")
ax.set_ylim(-0.3,1.2)
ax.set_ylim(-0.3,1.2)
plt.tight_layout()
plt.show()
结果如下
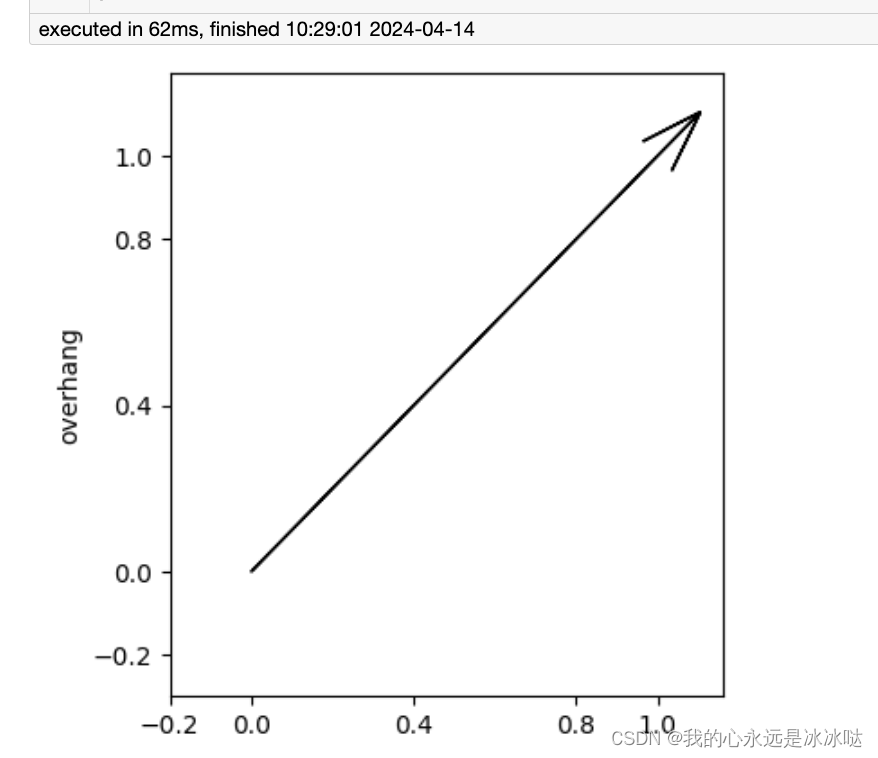 但是这个图有点问题,就是说这个箭头好像超出范围了
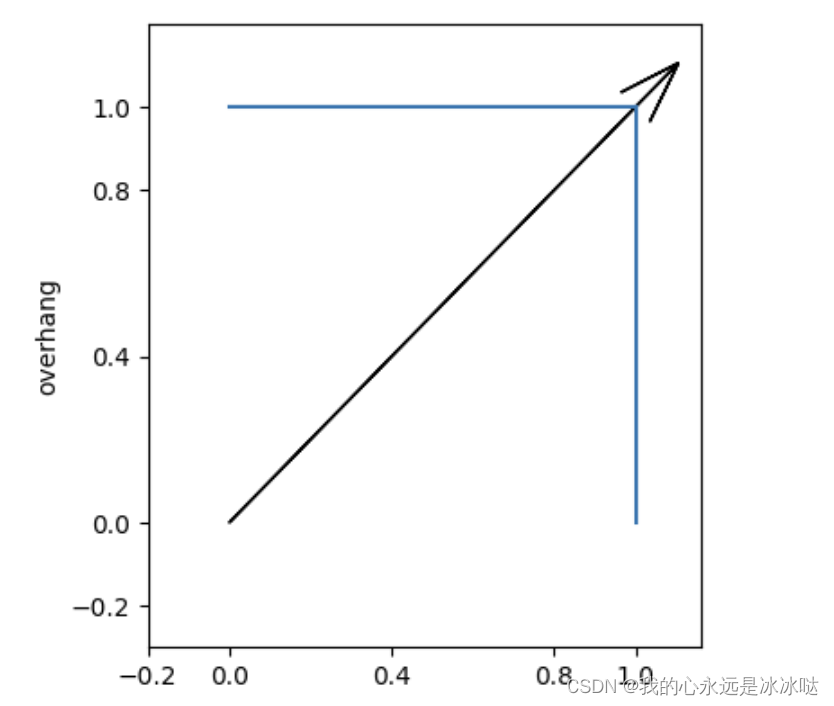
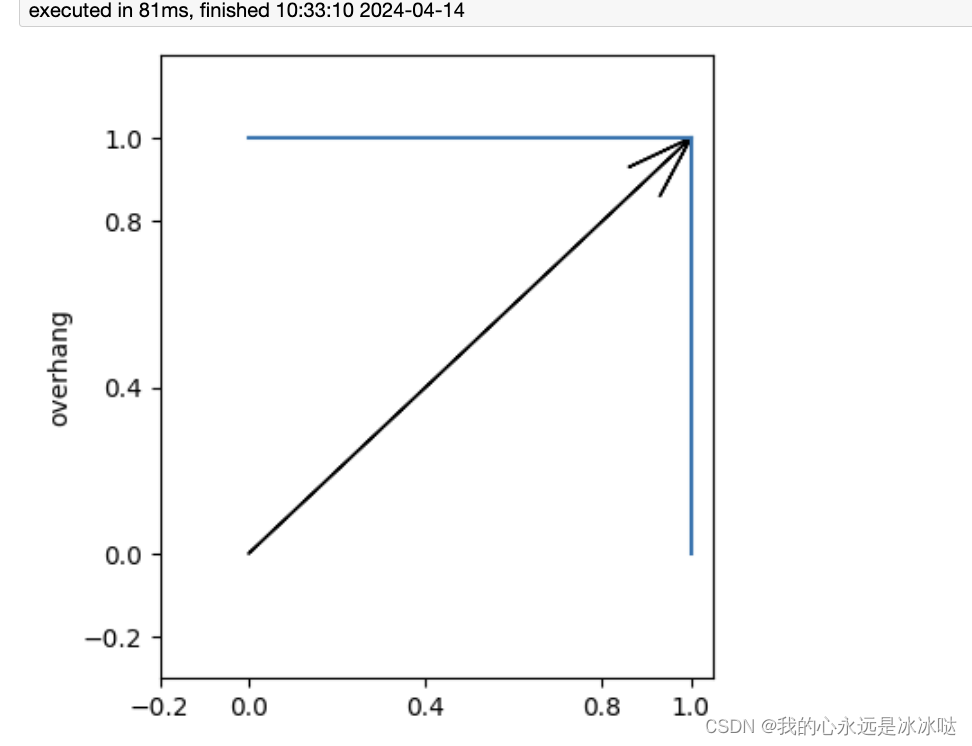
from matplotlib.lines import Line2D
import matplotlib.pyplot as plt
fig, ax = plt.subplots(figsize=(4,4))
overhang = 1.0
ax.arrow(0,0,1.0,1.0, width=0.001, color="k",
         head_width=0.1, head_length=0.15, overhang=overhang)


### 添加这个线感觉不是很对的,箭头超出范围了
x1 =[0,1]
y1 =[1,1]
line1= Line2D(x1,y1)
ax.add_line(line1)
x2 =[1,1]
y2 =[0,1]
line2= Line2D(x2,y2)
ax.add_line(line2)

ax.set_yticks([-0.2,0,0.4,0.8,1.0])
ax.set_xticks([-0.2,0,0.4,0.8,1.0])
ax.set_ylabel("overhang")
ax.set_ylim(-0.3,1.2)
ax.set_ylim(-0.3,1.2)
plt.tight_layout()
plt.show()
修改箭头指示范围(length_includes_head=True)
from matplotlib.lines import Line2D
import matplotlib.pyplot as plt
fig, ax = plt.subplots(figsize=(4,4))
overhang = 1.0
ax.arrow(0,0,1.0,1.0, width=0.001, color="k",
         head_width=0.1, head_length=0.15, overhang=overhang,length_includes_head=True)


### 添加这个线感觉不是很对的,箭头超出范围了
x1 =[0,1]
y1 =[1,1]
line1= Line2D(x1,y1)
ax.add_line(line1)
x2 =[1,1]
y2 =[0,1]
line2= Line2D(x2,y2)
ax.add_line(line2)

ax.set_yticks([-0.2,0,0.4,0.8,1.0])
ax.set_xticks([-0.2,0,0.4,0.8,1.0])
ax.set_ylabel("overhang")
ax.set_ylim(-0.3,1.2)
ax.set_ylim(-0.3,1.2)
plt.tight_layout()
plt.show()


 3476
3476


 被折叠的 条评论
为什么被折叠?
被折叠的 条评论
为什么被折叠?
 到【灌水乐园】发言


