


上一篇文章中,我们采用了plotly.figure_factory中的create_annotated_heatmap()去创建关系热图,这篇文章我们介绍一种在plotly官网上看到的方法
Heatmaps in Python (plotly.com)
目录
普通版
代码:
import plotly.express as px

z = [[.1, .3, .5, .7, .9],
     [1, .8, .6, .4, .2],
     [.2, 0, .5, .7, .9],
     [.9, .8, .4, .2, 0],
     [.3, .4, .5, .7, 1]]

fig = px.imshow(z, text_auto=True)
fig.show()
结果:
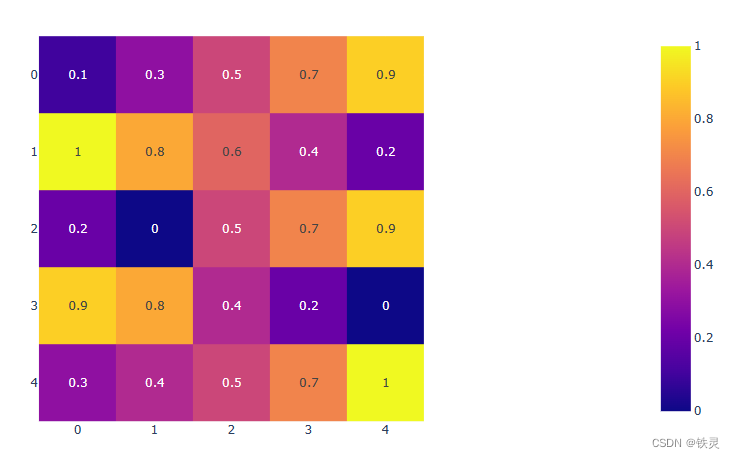
可以看出,和我们上一次介绍的关系热
 最低0.47元/天 解锁文章


 222
222


 被折叠的 条评论
为什么被折叠?
被折叠的 条评论
为什么被折叠?
 到【灌水乐园】发言


