


ds数据库
数据科学 (Data Science)
These days most companies are moving towards the concept of “Citizen Data Scientists” by giving tools to subject matter experts (SME) to create their own machine learning models. The advantage of this approach is that it provides a meaningful interpretation of the results and nothing gets lost in translation between the data scientist and the SME.
如今,大多数公司通过向主题专家(SME)提供工具来创建自己的机器学习模型,正在朝着“ 市民数据科学家 ”的概念发展。 这种方法的优势在于,它可以对结果进行有意义的解释,并且不会在数据科学家和SME之间的翻译中丢失任何内容。
While some citizen-data-scientists get trained in Python and R to develop models, these languages require some level of coding that some people may not be comfortable with. Data modeling platforms like JMP, Knime and Alteryx provide alternatives to programming and help you develop machine learning models simply by working with their inbuilt functionalities. In this article let’s discuss modeling with Alteryx.
虽然一些公民数据科学家接受过Python和R训练以开发模型,但这些语言需要某些人可能不满意的某种程度的编码。 诸如JMP,Knime和Alteryx之类的数据建模平台提供了编程的替代方法,并通过使用其内置功能来帮助您开发机器学习模型。 在本文中,我们讨论使用Alteryx进行建模。
The approach we will use here is the ‘SEMMA’ approach. ‘SEMMA’ stands for Sample, Explore, Modify, Model, and Assess. It is a list of sequential steps developed by the SAS Institute, one of the largest producers of statistics and business intelligence software. As with my previous articles, I will be using the Boston Housing Property 2019 dataset to model with Alteryx.
我们将在这里使用的方法是“ SEMMA ”方法。 “ SEMMA”代表“ 采样” ,“ 探索” ,“ 修改” ,“ 模型 ”和“ 评估” 。 它是SAS Institute (最大的统计和商业智能软件生产商之一)开发的一系列步骤的列表。 与之前的文章一样 ,我将使用Boston Housing Property 2019数据集与Alteryx进行建模。

第1步-示例: (STEP 1 — Sample:)
The process starts with data sampling, i.e., selecting the appropriate data set for modeling. The data set should be large enough to contain sufficient information to model effectively, yet small enough to be used efficiently.
该过程从数据采样开始,即选择合适的数据集进行建模。 数据集应足够大以包含足以有效建模的信息,而又要足够小以有效使用。
In the ‘Sample’ stage, we will load the data into Alteryx, filter by property type = 101 (single-family homes), and drop columns that are not required for analysis(Like the name, address, and rows not associated with single-family homes).
在“ 采样 ”阶段,我们将数据加载到Alteryx中,按属性类型= 101 (单户住宅)进行过滤,并删除分析不需要的列(例如名称,地址和与单行无关的行) -家庭住宅)。

Using the Input Data tool, I will import the excel dataset into Alteryx. Next using the filter tool will sort the rows containing only PTYPE = 101 as shown below.
使用输入数据工具,我将excel数据集导入Alteryx。 接下来,使用过滤器工具将仅包含PTYPE = 101的行排序,如下所示。


Next, select the rows required for analysis. (Remove fields like ST_Name, Owner, etc)
接下来,选择分析所需的行。 (删除诸如ST_Name,Owner等的字段)

Alteryx allows you to create ‘containers’ where you can group all the blocks for a function together like shown above. I created a container called “Find columns with Missing values” for doing the task the name suggests. I have reused this container multiple times to check if all the missing values have been imputed
Alteryx允许您创建“容器”,您可以在其中将功能的所有块组合在一起,如上所示。 我创建了一个名为“查找缺少值的列”的容器,用于执行顾名思义的任务。 我已多次重复使用此容器,以检查是否所有缺失值均已估算
第2步-探索: (STEP 2 — Explore:)
This phase covers understanding the data by exploring anticipated and unanticipated relationships between the variables and discover any abnormalities with the help of data visualization.
此阶段包括通过探索变量之间的预期和意外关系来理解数据,并借助数据可视化发现任何异常。
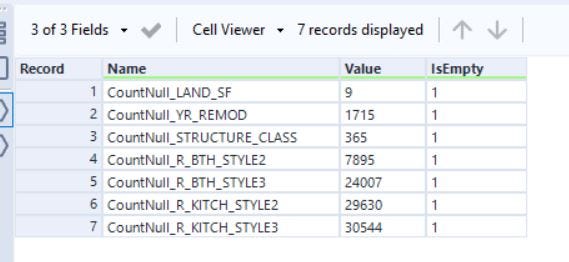
In this phase, we will impute all the missing data to prepare it for modeling. In the last step, we identified 7 columns with some missing values. In this step, we will impute these columns.
在这一阶段,我们将估算所有缺失的数据,以准备进行建模。 在最后一步中,我们确定了7列缺少值的列。 在这一步中,我们将估算这些列。

Imputation Strategy:
插补策略:
a) Land_SF: This is a continuous variable and I will impute this with mean of column
a)Land_SF:这是一个连续变量,我将用列均值来估算
b) YR_REMOD: This is the year the house was remodeled, if this is null, we will replace it with year built.
b)YR_REMOD:这是房屋改建的年份,如果为空,我们将用建造年份代替。
c) STRUCTURE_CLASS: This is the categorical variable. We will replace this with the mode of the column.
c)STRUCTURE_CLASS:这是类别变量。 我们将其替换为列的模式。
d) R_BTH_STYLE2 and R_BTH_STYLE3: We will calculate total_bath (total number of a full bath and half bath) parameter if the total bath is less than ‘2’, I will impute STYLE2 with ‘N/A’ similarly is total is less than ‘3’ STYLE3 will be ‘N/A’.
d)R_BTH_STYLE2和R_BTH_STYLE3:如果总浴池小于'2',我们将计算total_bath(全浴池和半浴池的总数)参数,类似地,我将STYLE2推算为'N / A',总和小于' 3'STYLE3将为'N / A'。
e) R_KITCH_STYLE2 and R_KITCH_STYLE3: Similar to the baths, if the number of the kitchen is less than 2 or 3, we will impute the values with,N/A’.
e)R_KITCH_STYLE2和R_KITCH_STYLE3:类似于浴室,如果厨房的数量少于2或3,我们将用N / A'来估算值。
All this can be done by using the Formula column easily.
所有这些都可以通过轻松地使用“公式”列来完成。


第3步-修改: (STEP 3 — Modify:)

In this step, we will
在这一步中,我们将
Transform Data/Create New Attributes: We will create a few new variables for our analysis:
转换数据/创建新属性:我们将为分析创建一些新变量:
a. Age: Calculate the age of the house(Current year- YR_BUILT)
一个。 年龄:计算房屋的年龄(当前年份-YR_BUILT)
b. YR_Since_Remod: Current Year — YR_REMOD)
b。 YR_Since_Remod:当前年份-YR_REMOD)
c. LogAV_Total = Log transform target variable
C。 LogAV_Total =对数转换目标变量

2. Attribute encoding:
2.属性编码:
We will check all the variable to make sure the data types are correct, delete original variables like YR_REMOD, YR_BUILT (using the select tool)as we have calculated new variables
我们将检查所有变量以确保数据类型正确,并在计算新变量时删除原始变量,例如YR_REMOD,YR_BUILT(使用选择工具)
3. Partition Data into training and validation set
3.将数据划分为训练和验证集
步骤4 —模型: (STEP 4 — Model:)
Model: In the Model phase the focus is on applying various modeling (data mining) techniques on the prepared variables in order to create models that possibly provide the desired outcome.
模型:在模型阶段,重点是对准备好的变量应用各种建模(数据挖掘)技术,以创建可能提供所需结果的模型。
We will fit 3 different models to our data: Decision Tree, Linear Regression, and Random Forest model on the training dataset and validate the model using the validation set.
我们将3种不同的模型拟合到我们的数据中:训练数据集上的决策树,线性回归和随机森林模型,并使用验证集对模型进行验证。

The image below shows the settings for cross-validation and score blocks. In cross-validation, you have to select the Number of folds and a seed. Score block lets you select if the predictor variable has been log-transformed or not.
下图显示了交叉验证和分数块的设置。 在交叉验证中,您必须选择倍数和种子。 得分块使您可以选择是否将预测变量进行对数转换。


A) Decision Tree Model
A)决策树模型

We will fit a decision tree on the training data and then use cross-validation on both training to compare ‘Mean Absolute Error’. To fit the decision tree model, we will use the decision tree block to select the target variable and predictor variables
我们将在训练数据上拟合决策树,然后在两次训练中使用交叉验证来比较“均值绝对误差”。 为了适应决策树模型,我们将使用决策树块来选择目标变量和预测变量


The cross-validation results show that Avg_MAE (Average Mean Absolute Error) is comparable hence this model is valid. The browse added after the decision tree model has more information and graphs.
交叉验证结果表明,Avg_MAE(平均平均绝对误差)具有可比性,因此该模型有效。 在决策树模型之后添加的浏览器具有更多信息和图形。
b) Linear Regression
b)线性回归

The first step is to select the Target variable and predictor variable.
第一步是选择目标变量和预测变量。

Once you run the Linear regression model, you will get the results shown below: Using the browse tool, you get various other graphs, I have shown only one of them here.
一旦运行了线性回归模型,您将得到如下所示的结果:使用浏览器工具,您可以获得各种其他图形,这里仅显示其中一个。

Once we have the linear regression model, we will score it to calculate Training and Validation error as shown below.
有了线性回归模型后,我们将对其评分以计算训练和验证误差,如下所示。

c) Random Forest
c)随机森林

The first step in Random Forest Modeling is to select the target variable and the predictor variable from the tool configuration. The next step is to select the number of trees. I chose to go with “100 trees”. If you are unsure of the number of trees, you can add multiple Random Forest blocks and test different tree depth and then select the tree depth which has the least Mean Absolute Error.
随机森林建模的第一步是从工具配置中选择目标变量和预测变量。 下一步是选择树木的数量。 我选择了“ 100棵树”。 如果不确定树的数量,可以添加多个“随机森林”块并测试不同的树深度,然后选择“平均绝对误差”最小的树深度。


Once we have a final random forest model, we will cross-validate the results on the training and validation dataset and calculate the percentage error. The results show that the training and validation set have a similar Mean Absolute error. The model outputs lots of other information that can be used to see if the model is valid.
一旦有了最终的随机森林模型,我们将对训练和验证数据集上的结果进行交叉验证,并计算百分比误差。 结果表明,训练和验证集具有相似的平均绝对误差。 模型输出许多其他信息,可用于查看模型是否有效。


第5步-评估: (STEP 5 — Assess:)
In this step, we will compare the different models using the Alteryx model comparison tool. We will compare the ‘MAE’ for the training and validation model and we will also look at the Predicted vs Actual graph.
在这一步中,我们将使用Alteryx模型比较工具比较不同的模型。 我们将比较训练和验证模型的“ MAE”,还将查看“预测与实际”图。


From the graphs and the table, we can see that the Random forest model has the lowest Mean Absolute error, followed by the Linear regression model.
从图表和表格中,我们可以看到随机森林模型的平均绝对误差最低,其次是线性回归模型。
Also from the cross-validation results, we can see that Mean Absolute error for training and validation test is similar, Hence there is no over fit and the model can be used for prediction.
从交叉验证结果还可以看出,训练和验证测试的平均绝对误差相似,因此不会出现过度拟合,并且该模型可用于预测。
结论 (Conclusion)
Alteryx gives you a very quick and powerful way to prepare the data for analysis and test machine learning models. Depending on the data size, cross-validation could take a bit longer to execute.
Alteryx为您提供了一种非常快速而强大的方法来准备用于分析和测试机器学习模型的数据。 根据数据大小,交叉验证可能需要更长的时间才能执行。
To speed up the modeling process in Alteryx, once you split and save the data into training and validation sets, run each model in a different workspace.
为了加快Alteryx中的建模过程,将数据拆分并保存到训练和验证集中后,请在不同的工作空间中运行每个模型。
You can learn more about Alteryx modeling from the Learning Guide in Alteryx official website as well as scores of tutorials and online help forums available. You can find the code for the example above on GITHUB.
您可以从Alteryx官方网站上的《 学习指南》以及许多可用的教程和在线帮助论坛中了解有关Alteryx建模的更多信息。 您可以在GITHUB上找到上述示例的代码。
ds数据库


 619
619

 被折叠的 条评论
为什么被折叠?
被折叠的 条评论
为什么被折叠?
 到【灌水乐园】发言


