


回归模型评估
An introduction and intuition, how evaluate regression and Classification model in general
介绍和直觉,一般如何评估回归和分类模型
1.简介 (1. Introduction)
Data scientists often use machine learning models to generate insight but wow does a Data scientist make a decision, whether the model will be implemented or not? When the model is implemented, there will be negative and positive impacts on the business. In order to prevent or minimize negative impacts, it is necessary to evaluate the model, so that it can estimate the positive impact and negative impact generated. Is this, model evaluation is one of the most important parts of machine learning.
数据科学家经常使用机器学习模型来产生洞察力,但是数据科学家是否会做出决策,即是否将实施模型? 实施模型后,将对业务产生负面和正面影响。 为了防止或最小化负面影响,有必要评估模型,以便可以估计产生的正面影响和负面影响。 就是这样,模型评估是机器学习最重要的部分之一。
In this moment, we’ll learn about the most important model performance metrics that can be used to assess the performance of a regression and classification model. Following is the list of metrics:
在这一刻,我们将学习最重要的模型性能指标,这些指标可用于评估回归和分类模型的性能。 以下是指标列表:
Regression
回归
- R-Squared R-平方
- RMSE : Root Mean Squared Error [0- infinity] RMSE:均方根误差[0-无穷大]
- MAE : Mean Absolute Error [0- infinity] MAE:平均绝对误差[0-无穷大]
Classification
分类
- Accuracy 准确性
- Precision 精确
- Recall 召回
- Specificity 特异性
- F1 Score F1分数
2.回归 (2. Regression)
In the regression case, the most popular evaluation models are R-Squared, RMSE, and MAE.
在回归的情况下,最受欢迎的评估模型是R-平方,RMSE和MAE。
R-平方 (R-Squared)
mathematically we can write R-Squared as following
数学上,我们可以这样写R-平方

we can say R-Squared formula asR-squared = Explained variation / Total variation
我们可以说R平方公式为R平方=解释方差/总方差
R-Squared : how well the predictions approximate the ground truth or how close the data are to the fitted regression line. In essence, R-Squared represents the proportion of the variance for a dependent variable that’s explained by an independent variable or variables in a regression model. R-squared is always between 0 and 1, in percentage always between 0 and 100%.
R-Squared:预测与地面实况的近似程度或数据与拟合回归线的接近程度。 本质上,R平方代表因变量的方差比例,该因变量由回归模型中的一个或多个自变量解释。 R平方始终在0到1之间,百分比始终在0到100%之间。
- 0% indicates that the model explains none of the variability of the response data around its mean. 0%表示该模型无法解释响应数据均值附近的变异性。
- 100% indicates that the model explains all the variability of the response data around its mean. 100%表示该模型解释了响应数据均值附近的所有可变性。
Plotting fitted values by observed values graphically illustrates different R-squared values for regression models.
通过观察值绘制拟合值以图形方式说明了回归模型的不同R平方值。

The regression model on the left accounts for 38.0% of the variance while the one on the right accounts for 87.4%. The more variance that is accounted for by the regression model the closer the data points will fall to the fitted regression line. Theoretically, if a model could explain 100% of the variance, the fitted values would always equal the observed values and, therefore, all the data points would fall on the fitted regression line [1]
左侧的回归模型占方差的38.0%,而右侧的模型占87.4%。 回归模型解释的方差越多,数据点落在拟合的回归线上越近。 从理论上讲,如果模型可以解释100%的方差,则拟合值将始终等于观测值,因此,所有数据点都将落在拟合回归线上[ 1 ]
RMSE和 MAE (RMSE and MAE)
RMSE : mathematically we can write RMSE as following
RMSE:在数学上,我们可以将RMSE编写如下

According to Wikipedia [2], RMSE (Root Mean Squared Error) is a frequently used measure of the differences between values (sample or population values) predicted by a model or an estimator and the values observed. RMSE is always non-negative, is always between 0 and infinity
根据Wikipedia [2],RMSE(均方根误差)是模型或估计器预测的值(样本或总体值)与观测值之间差异的常用度量。 RMSE始终为非负,始终在0到无穷大之间
MAE : mathematically we can write MAE as following
MAE:在数学上,我们可以将MAE编写如下

According to Wikipedia [3], MAE is a measure of errors between paired observations expressing the same phenomenon. Examples of Y versus X include comparisons of predicted versus observed, subsequent time versus initial time, and one technique of measurement versus an alternative technique of measurement[3].
根据Wikipedia [3],MAE是衡量表达相同现象的成对观测值之间的错误的量度。 Y与X的示例包括比较预测值与观察值,后续时间与初始时间,以及一种测量技术与另一种测量技术[ 3 ]。
When do we use RMSE and MAE?
我们什么时候使用RMSE和MAE?
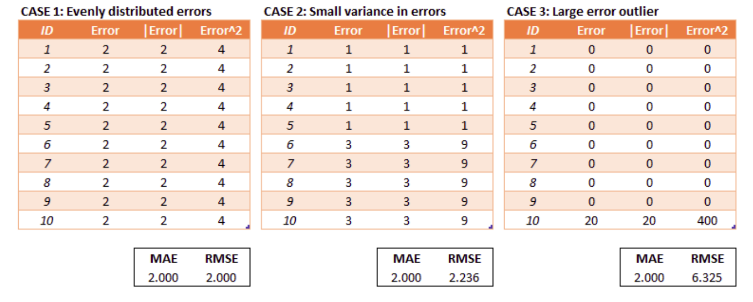
if the data have an outlier then the value of RMSE is higher than MAE, so RMSE is more “sensitive” than MAE. Using the RMSE is more appropriate if the data have a lot of outliers.
如果数据有异常值,则RMSE的值高于MAE,因此RMSE比MAE更“敏感”。 如果数据有很多异常值,则使用RMSE更合适。
3.分类 (3. Classification)
In the case of classification, there are some metrics to describe the performance of a classification model on a set of test data for which the true values are known.
在分类的情况下,存在一些度量来描述分类模型对一组已知真实值的测试数据的性能。
before discussing model evaluation on classification, we should understand the confusion matrix. A confusion matrix is a table that is often used to describe the performance of a classification model (or “classifier”) on a set of test data for which the true values are known. It allows the visualization of the performance of an algorithm.
在讨论分类模型评估之前,我们应该了解混淆矩阵。 混淆矩阵是一个表,通常用于描述针对一组已知真实值的测试数据的分类模型(或“分类器”)的性能。 它允许可视化算法的性能。

- Positive (P) : Observation is positive (for example: is an apple). 正面(P):观察结果为正面(例如:是一个苹果)。
- Negative (N) : Observation is not positive (for example: is not an apple). 负数(N):观察结果不是正数(例如:不是苹果)。
- True Positive (TP) : Observation is positive, and is predicted to be positive. 真实阳性(TP):观察结果为阳性,并且预计为阳性。
- False Negative (FN) : Observation is positive, but is predicted negative. 假阴性(FN):观察结果为阳性,但预计为阴性。
- True Negative (TN) : Observation is negative, and is predicted to be negative. 真阴性(TN):观察结果为阴性,预计为阴性。
- False Positive (FP) : Observation is negative, but is predicted positive. 假阳性(FP):观察结果为阴性,但预计为阳性。
准确性 (Accuracy)
Accuracy is the basic metric to evaluate classification models and measures the percentage of correctly predicted data against the total data. This is a metric that is best used for a balanced data set. In order to find out the accuracy, we should have a confusion matrix.
准确性是评估分类模型并衡量正确预测的数据相对于总数据的百分比的基本指标。 这是最适合平衡数据集的指标。 为了找出准确性,我们应该有一个混淆矩阵。

Accuracy = (TP + TN) / (TP + TN + FP + FN)Accuracy = (True positive+ True negative) /Total count of elementsIn this case, an accuracy is (44 + 37) / (44 + 37 + 15 + 4) = 81/100 = 81%.
精度=(TP + TN)/(TP + TN + FP + FN)精度=(真正+真负)/元素总数在这种情况下,精度为(44 + 37)/(44 + 37 + 15 + 4)= 81/100 = 81%。
精确 (Precision)
Precision is a metric that quantifies the number of correct positive predictions made. This is a metric that can be used for an unbalanced data set. In essence, It is calculated as the ratio of correctly predicted positive examples divided by the total number of positive examples that were predicted [4]
精确度是量化正确做出的正确预测的数量的度量。 这是可用于不平衡数据集的指标。 本质上,它是通过正确预测的阳性样本数除以预测的阳性样本总数的比值来计算的[ 4 ]
Merupakan rasio prediksi benar positif dibandingkan dengan keseluruhan hasil yang diprediksi positif. Precision menjawab pertanyaan “Berapa persen mahasiswa yang benar DO dari keseluruhan mahasiswa yang diprediksi DO?[5]
Merupakan rasio prediksi benar positif dibandingkan dengan keseluruhan hasil yang diprediksi positif。 精密menjawab pertanyaan“ Berapa persen mahasiswa yang benar DO dari keseluruhan mahasiswa yang diprediksi DO?[ 5 ]

Precision = (TP) / (TP + FP)Precision = (True positive) / (True positive + False positive)In this case, a precision is (44 ) / (44 + 15) = 44/59 = 74.6% ~ 3/4
精度=(TP)/(TP + FP)精度=(真正)/(真正+假正) 在这种情况下,精度为(44)/(44 + 15)= 44/59 = 74.6%〜3 / 4
For example, out of 4 emails predicted to be spam. There is 1 (4–3) email NOT SPAM which is categorized as SPAM. This metric that’s be used to avoid false positive predict (observation is negative, but is predicted positive)
例如,在预测为垃圾邮件的4封电子邮件中。 有1(4–3)封电子邮件不是垃圾邮件,被归类为垃圾邮件。 此度量标准用于避免错误的阳性预测 (观察为阴性,但被预测为阳性)
召回/灵敏度 (Recall / Sensitivity)
Recall is calculated as the number of true positives divided by the total number of true positives and false negatives. This is a metric that can be used for an unbalanced data set.
召回率的计算方法是:真实阳性的数量除以真实阳性和假阴性的总数。 这是可用于不平衡数据集的指标。
Merupakan rasio prediksi benar positif dibandingkan dengan keseluruhan data yang benar positif. Recall menjawab pertanyaan “Berapa persen mahasiswa yang diprediksi DO dibandingkan keseluruhan mahasiswa yang sebenarnya DO” [5]
Merupakan rasio prediksi benar positif dibandingkan dengan keseluruhan data yang benar positif。 回想一下menjawab pertanyaan“ Berapa persen mahasiswa yang diprediksi DO dibandingkan keseluruhan mahasiswa yang sebenarnya DO” [ 5 ]

Recall = (TP) / (TP + FN)Recall = (True positive) / (True positive + False negative)In this case, a recall is (40 ) / (40+ 10) = 40/50 = 80%
召回率=(TP)/(TP + FN)召回率=(真正)/(真正+假负) 在这种情况下,召回率是(40)/(40+ 10)= 40/50 = 80%
For example, out of 10 people who are predicted to be positive Covid 19. There were 2 people who failed to predict as positive for Covid 19. This is very dangerous, because the two people can infect other people. This metric is used to avoid false negative (Observation is positive, but is predicted negative)
例如,在预计Covid 19呈阳性的10人中,有2人未能对Covid 19呈阳性。这非常危险,因为这两个人可能感染其他人。 此度量标准用于避免假阴性 (观察为正,但预测为负)
特异性 (Specificity)
Specificity (also called the true negative rate) measures the proportion of actual negatives that are correctly identified as such
特异性(也称为真实阴性率)衡量的是正确识别出的实际阴性的比例
Merupakan kebenaran memprediksi negatif dibandingkan dengan keseluruhan data negatif. Specificity menjawab pertanyaan “Berapa persen mahasiswa yang benar diprediksi tidak DO dibandingkan dengan keseluruhan mahasiswa yang sebenarnya tidak DO” [5]
Merupakan kebenaran memprediksi negatif dibandingkan dengan keseluruhan数据negatif。 menjawab pertanyaan“ Berapa persen mahasiswa yang benar diprediksi tidak DO dibandingkan dengan keseluruhan mahasiswa yang sebenarnya tidak DO” [ 5 ]

Specificity = (TN) / (TN + FP)Specificity = (True negative) / (True negative + False positive)In this case, a recall is (98 ) / (98+ 2) = 98/100 = 98%
特异性=(TN)/(TN + FP)特异性=(真阴性)/(真阴性+假阳性)在这种情况下,召回率为(98)/(98+ 2)= 98/100 = 98%
For example in fraud detection, out of 100 is not a fraudulent transactions. The algorithm can correctly predict 98 transaction. This metric is used to maximize True negative rate.
例如,在欺诈检测中,每100个交易中就不是欺诈交易。 该算法可以正确预测98个事务。 此度量标准用于最大化真实否定率。
F1分数 (F1 Score)
F1 Score measure provides a way to combine both precision and recall into a single measure that captures both properties.
F1得分度量提供了一种将精度和召回率结合在一起的单一方法,可以同时捕获这两个属性。
As mentioned before, precision is a metric to minimize false positive rate (model too ‘confident’ labels data as ‘positive’). On the other hand, recall is a metric to minimize false positive rate (the model fails to detect data that is actually ‘positive’).
如前所述,精度是最小化误报率的指标(模型过于“自信”地将数据标记为“积极”)。 另一方面,召回是最小化误报率的指标(该模型无法检测到实际为“正”的数据)。
Is it possible to minimize both (FP & FN) simultaneously? Yes, it’s possible with F1 Score. F1 Score is comparison of average from precision and recall that’s weighted.
是否可以同时最小化两者(FP和FN)? 是的,F1得分是可能的。 F1得分是加权平均值与召回率平均值的比较。

F1 Score = 2 * (Recall*Precision) / (Recall + Precision)Precision = 5/(5+95) = 5%Recall = 5/(5+0) = 100 F1 score = (2 x 5% x 100%) / (5% + 100%) = 9.5%
F1分数= 2 *(召回率*精度)/(召回率+精度)精度= 5 /(5 + 95)= 5%召回率= 5 /(5 + 0)= 100 F1分数=(2 x 5%x 100% )/(5%+ 100%)= 9.5%
The score is very low but is quite fair. comparison of average from precision and recall that’s weighted. Thus, we are not fooled by 100% sensitivity.
分数很低,但是很公平。 精确度与召回率的平均值比较,并进行加权。 因此,我们不会被100%的灵敏度所迷惑。
结论 (Conclusion)
- R-squared : how well the predictions approximate the ground truth [0–100%] R平方:预测如何逼近地面真实度[0–100%]
- RMSE and MAE are more interpretable than R-squared and Using the RMSE is more appropriate if the data have a lot of outliers. RMSE和MAE比R平方更易于解释,如果数据有很多异常值,则使用RMSE更合适。
- Accuracy : This is a metric that is best used for a balanced data set 准确性:这是最适合平衡数据集的指标
- Precision : This metric that’s be used to avoid false positive predict (observation is negative, but is predicted positive) 精度:此度量标准可用于避免错误的阳性预测(观察值为负,但预测为阳性)
- Recall / Sensitivity : This metric that’s be used to avoid false negative (Observation is positive, but is predicted negative) and maximize True positive rate. 召回/敏感度:此度量标准用于避免假阴性(观察为正,但预测为负)并最大化真阳性率。
- Specificity : This metric is used to maximize True negative rate and minimize True positive rate. 特异性:此度量标准用于最大化真实阴性率和最小化真实阳性率。
- F1 Score : This metric that’s be used to minimize False positive and False negative F1得分:该指标用于最小化误报和误报
关于我 (About Me)
I’m a Data Scientist, Focus on Machine Learning and Deep Learning. You can reach me from Medium and Linkedin.
回归模型评估


 1427
1427

 被折叠的 条评论
为什么被折叠?
被折叠的 条评论
为什么被折叠?
 到【灌水乐园】发言


