


I’ve been having a great time playing around with Power BI, one of the most incredible things in the tool is the array of possibilities you have to transform your data.
我在玩Power BI方面玩得很开心,该工具中最令人难以置信的事情之一就是您必须转换数据的一系列可能性。
You can perform your transformations directly in your SQL query, use PowerQuery, DAX, R, Python or just by using their buttons and drop-boxes.
您可以直接在SQL查询中执行转换,可以使用PowerQuery,DAX,R,Python或仅通过其按钮和下拉框进行转换。
PBI gives us a lot of choices, but as much as you can load your entire database and figure your way out just with DAX, knowing a little bit o SQL can make things so much easier. Understanding the possibilities, where each of them excels, and where do we feel comfortable, is essential to master the tool.
PBI给我们提供了许多选择,但是尽您可以加载整个数据库并仅使用DAX来解决问题,知道一点点SQL可以使事情变得如此简单。 掌握各种可能性,每种方法的优势以及我们感到舒适的地方,对于掌握该工具至关重要。
In this article, I’ll go through the basics of using Python to transform your data for building visualizations in Power BI.
在本文中,我将介绍使用Python转换数据以在Power BI中构建可视化的基础知识。
勘探 (Exploration)
For the following example, I’ll use Jupyter Lab for exploring the dataset and designing the transformations.
对于以下示例,我将使用Jupyter Lab探索数据集并设计转换。
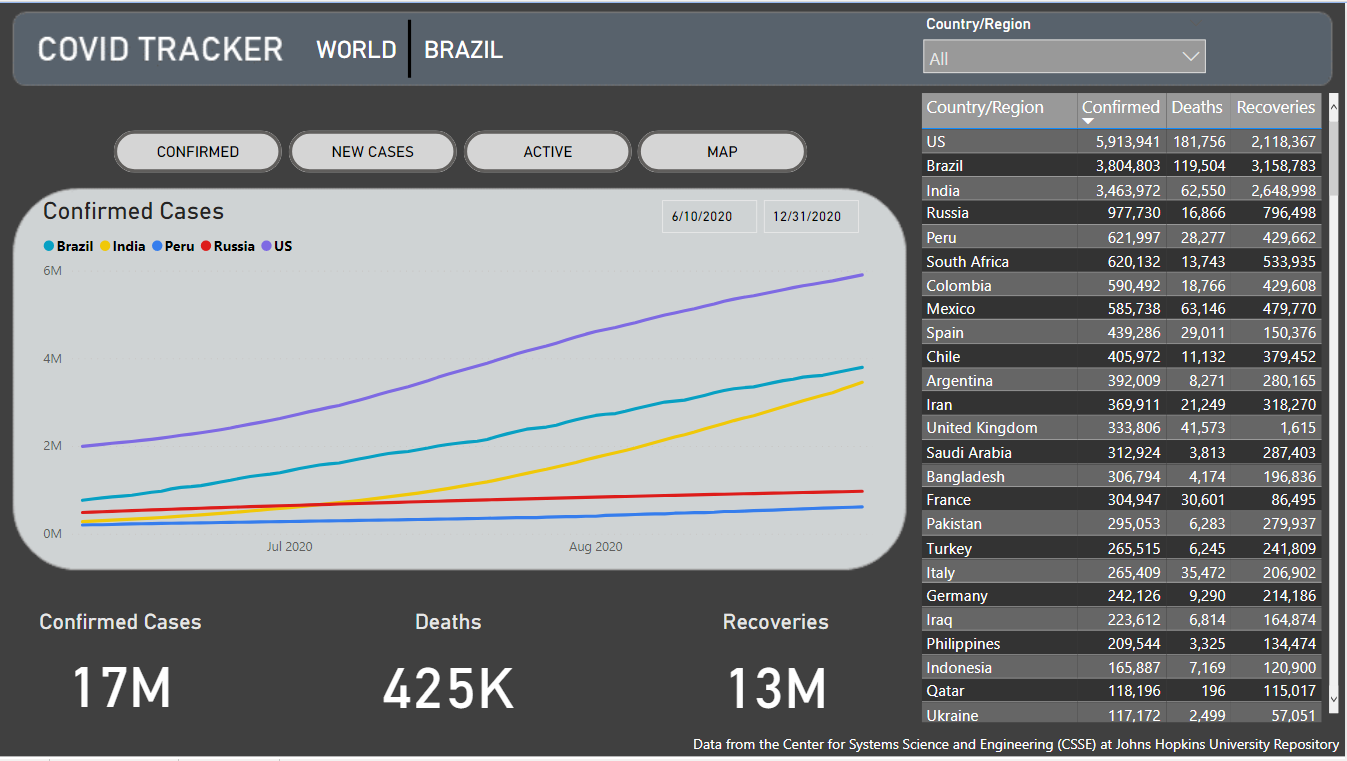
The dataset I’ll use is the COVID-19 Data Repository by the Center for Systems Science and Engineering (CSSE) at Johns Hopkins University.
我将使用的数据集是约翰霍普金斯大学系统科学与工程中心(CSSE)的COVID-19数据存储库 。
import pandas as pdgit = 'https://raw.githubusercontent.com/CSSEGISandData/COVID-19/master/csse_covid_19_data/csse_covid_19_time_series/time_series_covid19_confirmed_global.csv'dataset = pd.read_csv(git)dataset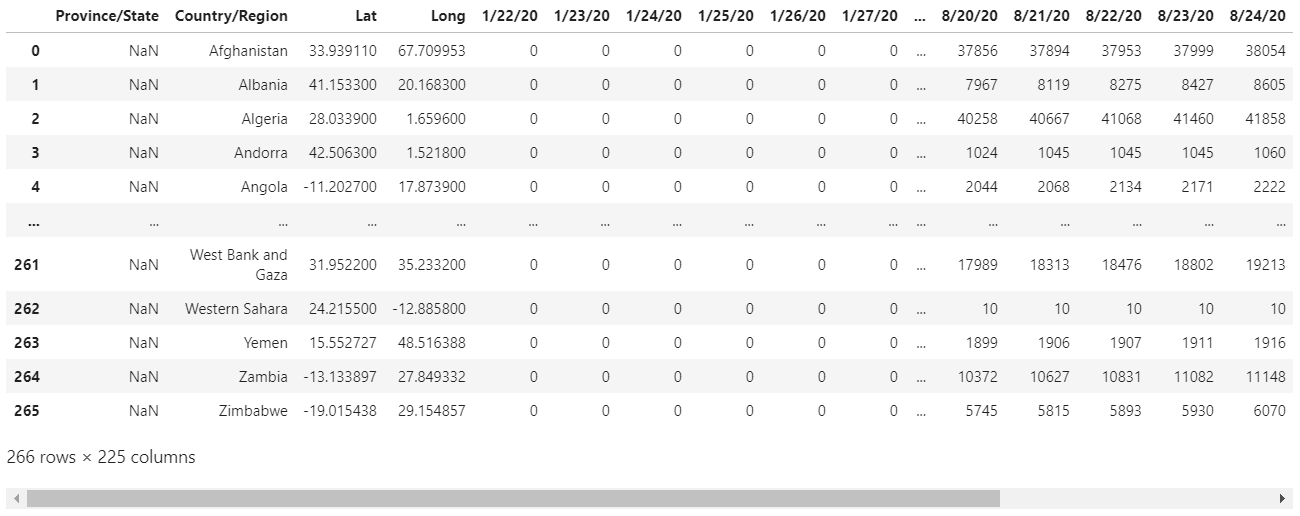
OK, so we loaded the dataset to a Pandas data frame, the same format we’ll receive it when performing the transformation in PBI.
好的,因此我们将数据集加载到了Pandas数据框中,与在PBI中执行转换时会收到的格式相同。
The first thing that called my attention in this dataset was its arrangement. The dates are spread through the columns, and that’s not a very friendly format for building visualizations in PBI.
在这个数据集中引起我注意的第一件事是它的排列。 日期分布在各列中,对于在PBI中构建可视化而言,这不是一种非常友好的格式。
Another noticeable thing is the amount of NaNs in the Province/State column. Let’s get a better look at the missing values with MissingNo.
另一个值得注意的事情是“省/州”列中的NaN数量。 让我们用MissingNo 更好地查看缺失值 。
import missingno as msnomsno.matrix(dataset)
Alright, mostly, our dataset is complete, but the Province/State column does have lots of missing values.
好吧,大多数情况下,我们的数据集是完整的,但是“省/州”列确实有很多缺失值。
While exploring, we can also check for typos and mismatching fields. There are lots of methods for doing so. I’ll use Difflib for illustrating.
在探索期间,我们还可以检查拼写错误和不匹配的字段。 有很多这样做的方法。 我将使用Difflib进行说明。
from difflib import SequenceMatcher# empty lists for assembling the data frame
diff_labels = []
diff_vals = []# for every country name check every other country name
for i in dataset['Country/Region'].unique():
    for j in dataset['Country/Region'].unique():
        if i != j:
            diff_labels.append(i + ' - ' + j)
            diff_vals.append(SequenceMatcher(None, i, j).ratio() )# assemble the data frame
diff_df = pd.DataFrame(diff_labels)
diff_df.columns = ['labels']
diff_df['vals'] = diff_vals# sort values by similarity ratio
diff_df.sort_values('vals', ascending=False)[:50]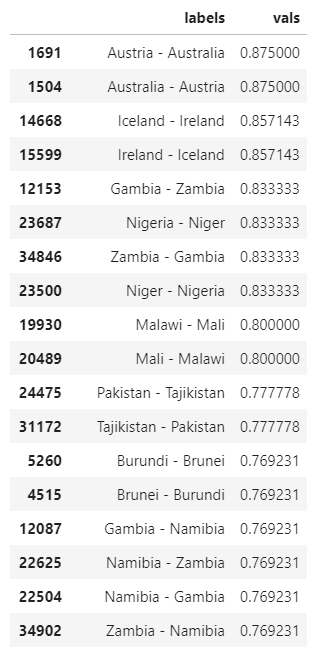
From what I can see, most of them are just similar, so this field is already clean.
从我的看到,它们大多数都是相似的,因此该字段已经很干净了。
As much as we could also check Provinces/ States, I guess I can pick typos from the names of countries, but not from provinces or states.
尽我们所能检查省/州,我想我可以从国家/地区名称中选择错别字,但不能从省或州中选择错别字。
目标 (Goal)
Whatever it is your exploration analysis, you’ll probably come up with a new design for the data you want to visualize.
无论您的勘探分析是什么,您都可能会想出想要可视化数据的新设计。
Something that’ll make your life easier when building the charts, and my idea here is to separate this dataset into three tables, like so:
可以简化构建图表时的工作,我的想法是将数据集分成三个表,如下所示:
One table will hold Location, with Province/State, Country/Region, Latitude, and Longitude.
一张桌子将保存位置,省/州,国家/地区,纬度和经度。
One will hold the data for countries, with the date, number of confirmed and number of new cases.
一个将保存国家/地区的数据,以及日期,确诊数量和新病例数量。
And the last one will hold data for the provinces, also with the date, number of confirmed and number of new cases.
最后一个将保存各省的数据,以及日期,确诊数和新病例数。
Here’s what I’m looking for as the final result:
这是最终结果:
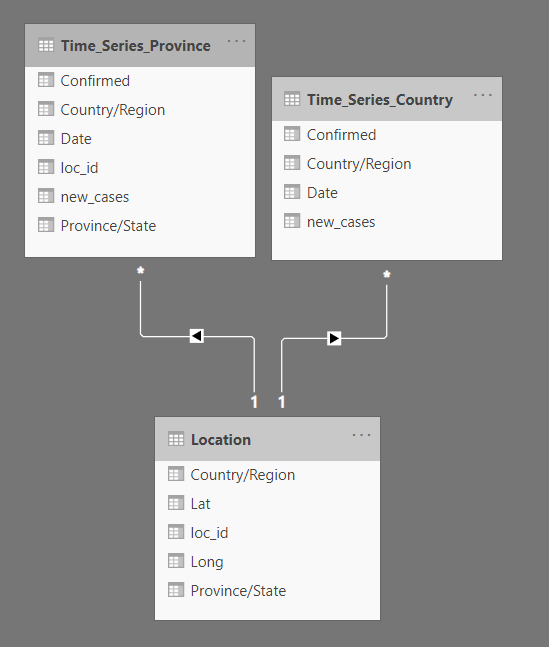
Are there better ways of arranging this dataset? — Most definitely, yes. But I think this is a good way of illustrating a goal for the dataset we want to achieve.
有更好的方法来安排此数据集吗? —绝对是的。 但是我认为这是说明我们要实现的数据集目标的好方法。
Python脚本 (Python Scripts)
Cool, we did a little exploration and came up with an idea of what we want to build. Now we can design the transformations.
太酷了,我们进行了一些探索,并提出了我们想要构建的构想。 现在我们可以设计转换。
Location is the easiest. We only need to select the columns we want.
位置最简单。 我们只需要选择所需的列。
cols = ['Province/State', 'Country/Region', 'Lat', 'Long']
location = dataset[cols]location
To get this to Power BI, we’ll need a new data source, and since we’re bringing it from a GitHub raw CSV, we can choose ‘web.’
要将其发送到Power BI,我们将需要一个新的数据源,并且由于我们是从GitHub原始CSV中获取数据,因此我们可以选择“网络”。
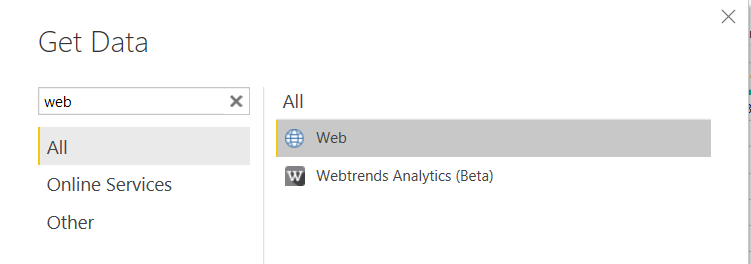
Now we can add the URL for the CSV and click go till we have our new source.
现在,我们可以添加CSV的URL,然后单击“转到”,直到获得新的源。
https://raw.githubusercontent.com/CSSEGISandData/COVID-19/master/csse_covid_19_data/csse_covid_19_time_series/time_series_covid19_confirmed_global.csv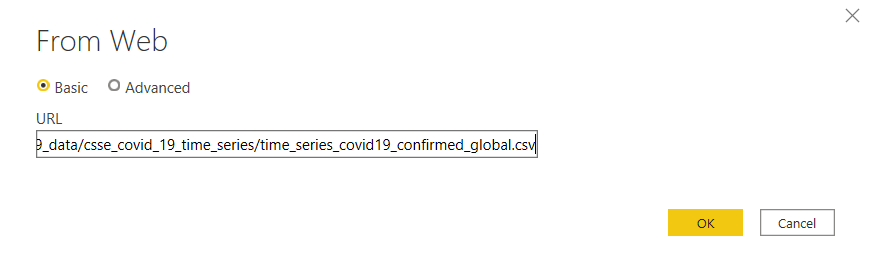
After you finish loading your dataset, you can go to ‘Transform data’, select the table we just imported, and go to the ‘Transform’ tab.
加载完数据集后,可以转到“转换数据”,选择我们刚刚导入的表,然后转到“转换”选项卡。
First, we’ll promote the first row to Headers.
首先,我们将第一行提升为Headers。

Then on the same tab, we can select ‘Run Python script’.
然后在同一标签上,我们可以选择“运行Python脚本”。
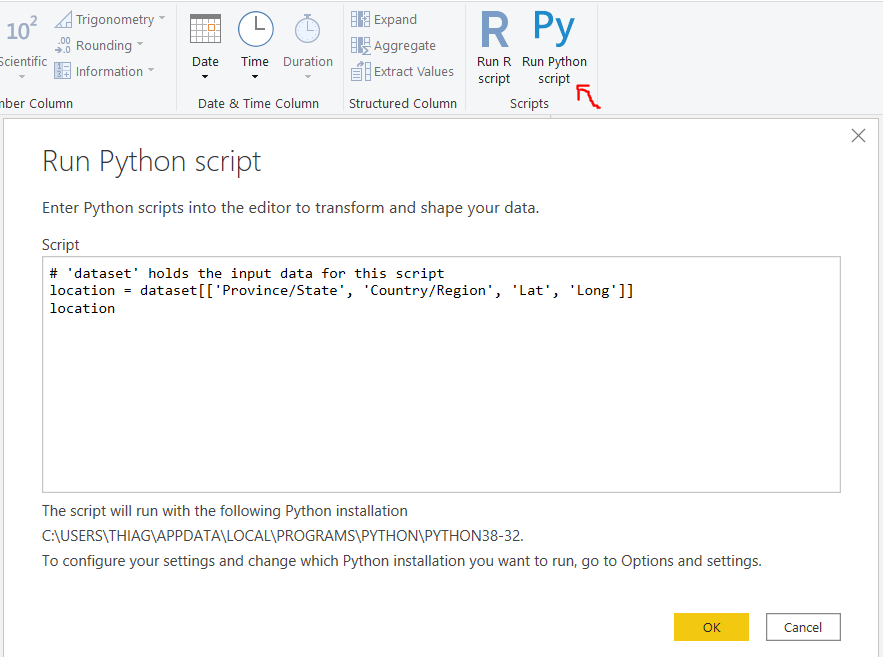
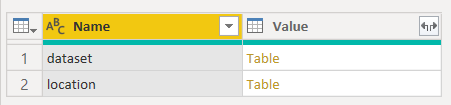
Here we’ll use the script we just wrote in Jupyter and press OK. Then we can choose the location Table we just made.
在这里,我们将使用刚刚在Jupyter中编写的脚本,然后按OK。 然后,我们可以选择刚才创建的位置表。

Excellent, it’s arguably way more comfortable to do that with PBI only, but now we know how to use this transformation, and we can add some complexity.
太好了,可以说仅使用PBI可以更轻松地完成此操作,但是现在我们知道了如何使用此转换,并且可以增加一些复杂性。
Let’s make the Province Time-Series transformations in Jupyter.
让我们在Jupyter中进行省时间序列转换。
增加复杂性 (Add Complexity)
We’ll drop the columns we don’t need, set the new index, and stack the dates in a single column.
我们将删除不需要的列,设置新索引,并将日期堆叠在单个列中。
# drop lat and long
Time_Series_P = dataset.drop(['Lat', 'Long'], axis=1)# set country and province as index
Time_Series_P.set_index(['Province/State', 'Country/Region'], inplace=True)# stack date columns
Time_Series_P = Time_Series_P.stack()
Time_Series_P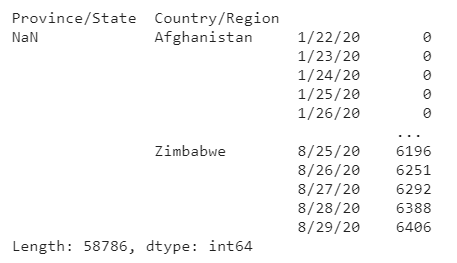
Next, we can convert that series back to a data frame, reset the index, and rename the columns.
接下来,我们可以将该系列转换回数据框,重置索引,然后重命名列。
Time_Series_P = Time_Series_P.to_frame(name='Confirmed')
Time_Series_P.reset_index(inplace=True)col_names = ['Province/State', 'Country/Region',
             'Date', 'Confirmed']
Time_Series_P.columns = col_namesTime_Series_P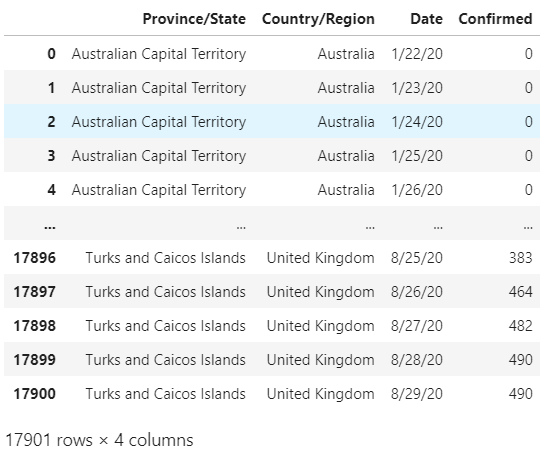
Cool, we already have the rows/ columns figured out. But I still want to add a column with ‘new cases’.
太酷了,我们已经弄清楚了行/列。 但是我仍然想添加一列“新案例”。
For that, we’ll need to sort our values by province and date. Then we’ll go through each row checking if it has the same name as the one before it. If it does, we should calculate the difference between those values. If not, we should use the amount in that row.
为此,我们需要按省和日期对值进行排序。 然后,我们将遍历每一行,检查其名称是否与之前的名称相同。 如果是这样,我们应该计算这些值之间的差。 如果没有,我们应该使用该行中的金额。
Time_Series_P['Date'] = pd.to_datetime(Time_Series_P['Date'])
Time_Series_P['Date'] = Time_Series_P['Date'].dt.strftime('%Y/%m/%d')Time_Series_P.sort_values(['Province/State', 'Date'], inplace=True)c = ''
new_cases = []
for index, value in Time_Series_P.iterrows():
    if c != value['Province/State']:
        c = value['Province/State']
        val = value['Confirmed']
        new_cases.append(val)
    else:
        new_cases.append(value['Confirmed'] - val)
        val = value['Confirmed']
Time_Series_P['new_cases'] = new_cases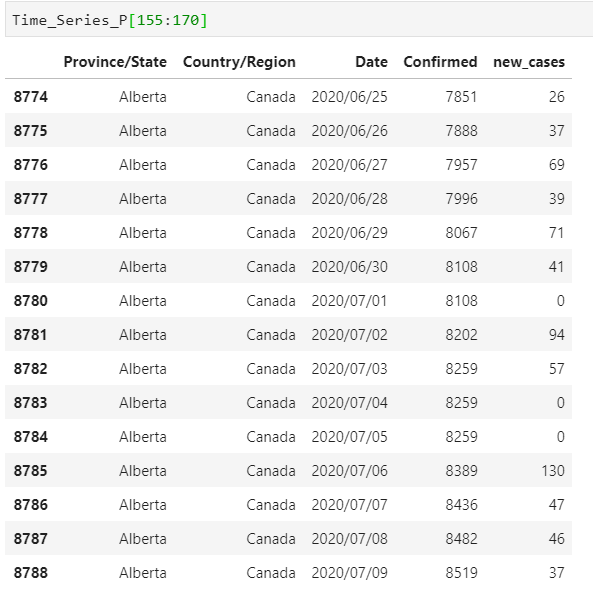
I guess that’s enough. We transformed the dataset, and we have it exactly how we wanted. Now we can pack all this code in a single script and try it.
我想就足够了。 我们转换了数据集,并得到了我们想要的。 现在,我们可以将所有这些代码打包在一个脚本中并尝试。
Time_Series_P = dataset.drop(['Lat', 'Long'], axis=1).set_index(['Province/State', 'Country/Region']).stack()
Time_Series_P = Time_Series_P.to_frame(name='Confirmed').reset_index()
Time_Series_P.columns = ['Province/State', 'Country/Region', 'Date', 'Confirmed']
Time_Series_P.dropna(inplace=True)Time_Series_P['Date'] = pd.to_datetime(Time_Series_P['Date'])
Time_Series_P['Date'] = Time_Series_P['Date'].dt.strftime('%Y/%m/%d')Time_Series_P.sort_values(['Province/State', 'Date'], inplace=True)c = ''
new_cases = []
for index, value in Time_Series_P.iterrows():
    if c != value['Province/State']:
        c = value['Province/State']
        val = value['Confirmed']
        new_cases.append(val)
    else:
        new_cases.append(value['Confirmed'] - val)
        val = value['Confirmed']
Time_Series_P['new_cases'] = new_cases
Time_Series_P[155:170]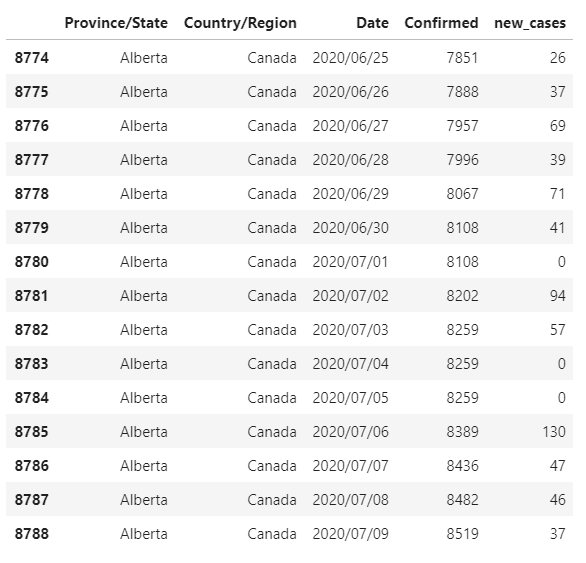
We already know how to get this to PBI. Let’s duplicate our last source, and change the python script in it, like so:
我们已经知道如何将其用于PBI。 让我们复制最后一个源,并在其中更改python脚本,如下所示:
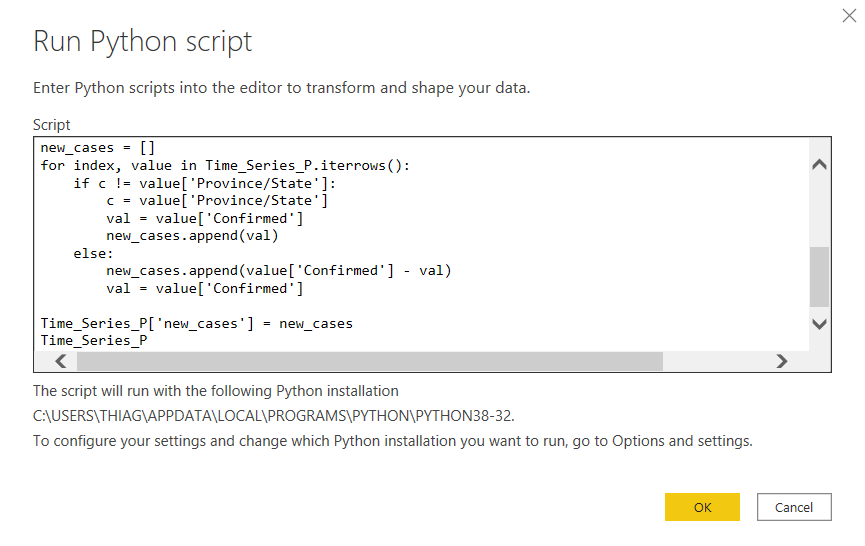
I don’t know how to create relationships in PBI with composite keys, so for connecting Location to Time_Series_P, I’ve used DAX to build a calculated column concatenating province and country.
我不知道如何使用复合键在PBI中创建关系,因此,为了将Location连接到Time_Series_P,我使用了DAX来构建计算得出的连接省和国家/地区的列。
loc_id = CONCATENATE(Time_Series_Province[Province/State], Time_Series_Province[Country/Region])That’s it! You can also use similar logic to create the country table.
而已! 您也可以使用类似的逻辑来创建国家/地区表。
Time_Series_C = dataset.drop(['Lat', 'Long', 'Province/State',], axis=1).set_index(['Country/Region']).stack()
Time_Series_C = Time_Series_C.to_frame(name='Confirmed').reset_index()
Time_Series_C.columns = ['Country/Region', 'Date', 'Confirmed']
Time_Series_C = Time_Series_C.groupby(['Country/Region', 'Date']).sum().reset_index()Time_Series_C['Date'] = pd.to_datetime(Time_Series_C['Date'])
Time_Series_C['Date'] = Time_Series_C['Date'].dt.strftime('%Y/%m/%d')Time_Series_C.sort_values(['Country/Region', 'Date'], inplace=True)c = ''
new_cases = []
for index, value in Time_Series_C.iterrows():
    if c != value['Country/Region']:
        c = value['Country/Region']
        val = value['Confirmed']
        new_cases.append(val)
    else:
        new_cases.append(value['Confirmed'] - val)
        val = value['Confirmed']
Time_Series_C['new_cases'] = new_cases
Time_Series_C
I guess that gives us an excellent idea of how to use Python transformations in PBI.
我想这给了我们一个很好的想法,如何在PBI中使用Python转换。
结论 (Conclusion)
Having options and knowing how to use them is always a good thing; all of those transformations could have been done with PBI only. For example, it’s way easier to turn all those columns with dates to rows by selecting them and clicking ‘Unpivot columns’ in the transformation tab.
有选择并知道如何使用它们总是一件好事。 所有这些转换只能通过PBI完成。 例如,通过选择所有日期日期列将其转换为行,然后在转换选项卡中单击“取消透视列”,将变得更加容易。
But there may be times where you find yourself lost in the tool, or you need more control over the operation, and many cases where Python may have that library to implement the solution you were seeking.
但是有时您可能会发现自己迷失在该工具中,或者需要对操作进行更多控制,并且在许多情况下,Python可能具有该库来实现您要寻找的解决方案。
All said and done — it’s time to design your visualization.
总而言之,这是设计可视化的时候了。
Thanks for reading my article. I hope you enjoyed it.
感谢您阅读我的文章。 我希望你喜欢它。


 335
335


 被折叠的 条评论
为什么被折叠?
被折叠的 条评论
为什么被折叠?
 到【灌水乐园】发言


