


 本文探讨了如何进行季节性时间序列数据的探索性数据分析,适用于大数据和人工智能背景下的机器学习和数据分析项目。
季节性时间序列数据分析
为什么要进行探索性数据分析? (Why Exploratory Data Analysis?)
You might have heard that before proceeding with a machine learning problem it is good to do en end-to-end analysis of the data by carrying a proper exploratory data analysis. A common question that pops in people’s head after listening to this as to why EDA?
您可能已经听说,在进行机器学习问题之前,最好通过进行适当的探索性数据分析来对数据进行端到端分析。 听了为什么要使用EDA的一个普遍问题在人们的脑海中浮现。
· What is it, that makes EDA so important?
·这是什么使EDA如此重要?
· How to do proper EDA and get insights from the data?
·如何进行适当的EDA并从数据中获取见解?
· What is the right way to begin with exploratory data analysis?
·探索性数据分析的正确方法是什么?
So, let us how we can perform exploratory data analysis and get useful insights from our data. For performing EDA I will take dataset from Kaggle’s M5 Forecasting Accuracy Competition.
因此,让我们了解如何进行探索性数据分析并从数据中获得有用的见解。 为了执行EDA,我将从Kaggle的M5预测准确性竞赛中获取数据集。
了解问题陈述: (Understanding the Problem Statement:)
Before you begin EDA, it is important to understand the problem statement. EDA depends on what you are trying to solve or find. If you don’t sync your EDA with respect to solving the problem it will just be plain plotting of meaningless graphs.
开始EDA之前,了解问题陈述很重要。 EDA取决于您要解决或找到的内容。 如果您不同步您的EDA以解决问题,那将只是无意义的图形的简单绘图。
Hence, before you begin understand the problem statement. So, let us understand the problem statement for this data.
因此,在您开始理解问题陈述之前。 因此,让我们了解此数据的问题陈述。
问题陈述: (Problem Statement:)
We here have a hierarchical data for products for Walmart store for different categories from three states namely, California, Wisconsin and Texas. Looking at this data we need to predict the sales for the products for 28 days. The training data that we have consist of individual sales for each product for 1914 days. Using this train data we need to make a prediction on the next days.
我们在这里拥有来自三个州(加利福尼亚州,威斯康星州和德克萨斯州)不同类别的沃尔玛商店产品的分层数据。 查看这些数据,我们需要预测产品28天的销售量。 我们拥有的培训数据包括1914天每种产品的个人销售。 使用此火车数据,我们需要在未来几天进行预测。
We have the following files provided from as the part of the competition:
作为比赛的一部分,我们提供了以下文件:
- calendar.csv — Contains information about the dates on which the products are sold. calendar.csv-包含有关产品销售日期的信息。
- sales_train_validation.csv — Contains the historical daily unit sales data per product and store [d_1 — d_1913] sales_train_validation.csv-包含每个产品和商店的历史每日单位销售数据[d_1-d_1913]
- sample_submission.csv — The correct format for submissions. Reference the Evaluation tab for more info. sample_submission.csv —提交的正确格式。 请参考评估选项卡以获取更多信息。
- sell_prices.csv — Contains information about the price of the products sold per store and date. sell_prices.csv-包含有关每个商店和日期出售产品的价格的信息。
- sales_train_evaluation.csv — Includes sales [d_1 — d_1941] (labels used for the Public leaderboard) sales_train_evaluation.csv-包括销售[d_1-d_1941](用于公共排行榜的标签)
Using this dataset we need to make the sales prediction for the next 28 days.
使用此数据集,我们需要对未来28天进行销售预测。
分析数据框: (Analyzing Dataframes:)
Now, after you have understood the problem statement well, the first thing to do, to begin with, EDA, is analyze the dataframes and understand the features that are present in our dataset.
现在,在您很好地理解了问题陈述之后,首先要做的是EDA,首先要分析数据框并了解数据集中存在的特征。
As mentioned earlier, for this data we have 5 different CSV files. Hence, to begin with, EDA we will first print the head of each of the dataframe to get the intuition of features and the dataset.
如前所述,对于此数据,我们有5个不同的CSV文件。 因此,首先,EDA我们将首先打印每个数据框的头部,以获取要素和数据集的直觉。
Here, I am using Python’s pandas library for reading the data and printing the first few rows. View the first few rows and write your observations.:
在这里,我正在使用Python的pandas库读取数据并打印前几行。 查看前几行并写下您的观察结果:
日历数据: (Calendar Data:)
First Few Rows:
前几行:
Value Counts Plot:
值计数图:
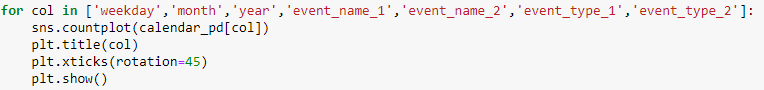
To get a visual idea about our data we will plot the value counts in each of the category of calendar dataframe. For this we will use the Seaborn library.
为了对我们的数据有一个直观的了解,我们将在日历数据框的每个类别中绘制值计数。 为此,我们将使用Seaborn库。

日历数据框的观察结果: (Observations from Calendar Dataframe:)
We have the date, weekday, month, year and event for each of day for which we have the forecast information.
我们拥有每天的日期 , 工作日 , 月份 , 年份和事件 ,并为其提供了预测信息。
- Also, we see many NaN vales in our data especially in the event fields, which means that for the day there is no event, we have a missing value placeholder. 同样,我们在数据中看到许多NaN值,尤其是在事件字段中,这意味着在没有事件的那天,我们缺少一个占位符。
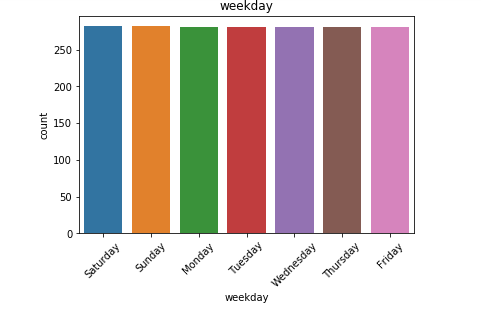
- We have data for all the weekdays with equal counts. Hence, it is safe to say we do not have any kind of missing entries here. 我们拥有所有平日的数据,并且计数相同。 因此,可以肯定地说我们在这里没有任何缺失的条目。
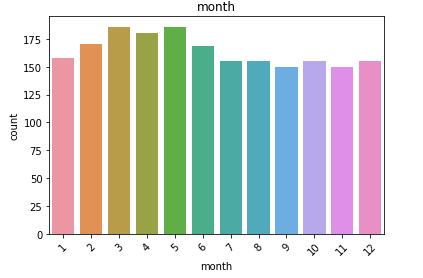
- We have a higher count of values for the month of March, April and May. For the last quarter, the count is low. 我们在3月,4月和5月的值计数更高。 对于最后一个季度,这一数字很低。
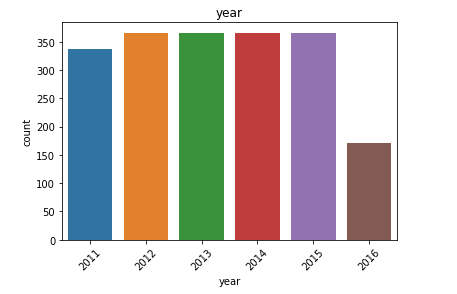
- We have data from 2011 to 2016. Although we don’t have the data for all the days of 2016. This explains the higher count of values for the first few months. 我们拥有2011年至2016年的数据。尽管我们没有2016年所有时间的数据。这解释了前几个月的价值较高。
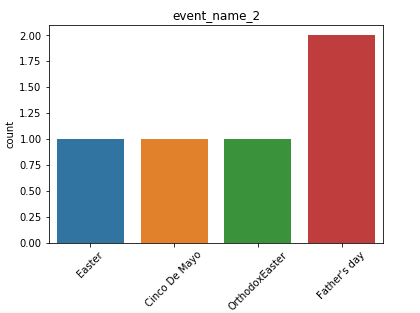
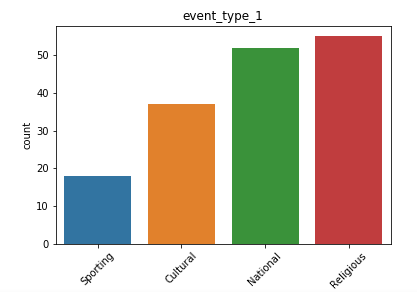
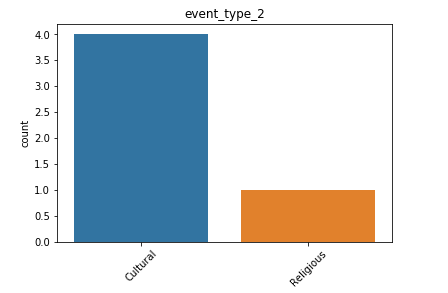
- We also have a list of events, that might be useful in analyzing trends and patterns in our data. 我们还提供了事件列表,这可能有助于分析数据中的趋势和模式。
- We have more data for cultural events rather than religious events. 我们有更多的文化活动而非宗教活动数据。
Hence, by just plotting a few basic graphs we are able to grab some useful information about our dataset that we didn’t know earlier. That is amazing indeed. So, let us try the same for other CSV files we have.
因此,只需绘制一些基本图形,我们就可以获取一些我们之前不知道的有关数据集的有用信息。 确实是太神奇了。 因此,让我们对已有的其他CSV文件尝试相同的操作。
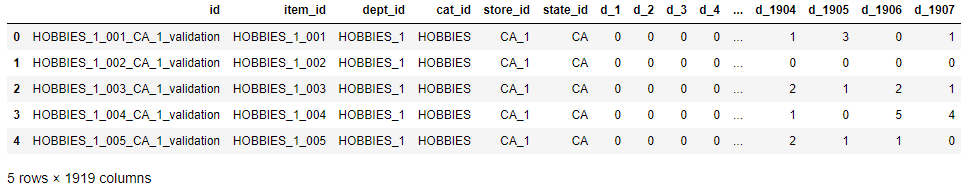
销售验证数据集: (Sales Validation Dataset:)
First few rows:
前几行:
Next, we will explore the validation dataset provided to us:
接下来,我们将探索提供给我们的验证数据集:
Value cou
 最低0.47元/天 解锁文章


 2833
2833

 被折叠的 条评论
为什么被折叠?
被折叠的 条评论
为什么被折叠?
 到【灌水乐园】发言


