


使用机器学习预测天气
Based on every NFL play from 2009–2017
根据2009-2017年每场NFL比赛
Ah, yes. The times, they are changin’. The leaves are beginning to fall, the weather is slowly starting to cool down (unless you’re where I’m at in LA, where it’s only getting hotter), and the mental transition of changing from shorts & sandals to jeans & hoodies is beginning. But, there is one other great fall tradition peeking its head over the horizon — FOOTBALL SEASON! Well, hopefully. Cause you know… Coronavirus.
是的。 时代在变。 叶子开始掉落,天气开始慢慢降温(除非您在我在洛杉矶的地方,那里只会变得更热),从短裤和凉鞋到牛仔裤和帽衫的转变是一种精神上的转变开始。 但是,还有另一种伟大的秋季传统正在悄然兴起–足球赛季! 好吧,希望如此。 因为你知道……冠状病毒。
I love football. I am a deeply rooted Minnesota Vikings fan, and every season I can go into Week 1 fully optimistic that “this is our year!” Because, for those who may not know, my Vikings have never… won… a Super Bowl. *sigh*
我爱足球。 我是明尼苏达州维京人队的根深蒂固的球迷,每个赛季我都可以完全乐观地认为“今年是我们的一年!” 因为,对于那些可能不知道的人,我的维京人从来没有……赢得过……超级碗。 *叹*
There have been 54 Super Bowls and the Vikings don’t have a single trophy. But like I said, this is our year!
已经有54个超级碗,维京人没有一个奖杯。 但是就像我说的,这是我们的一年!
On top of loving football, I also love working with data. And as an aspiring data scientist, I decided to take these two passions and join them together. I’m excited to share my process on answering the ever important question in the football world— can we use data to predict touchdowns?
除了热爱足球,我还喜欢使用数据。 作为一名有抱负的数据科学家,我决定接受这两种激情并将它们融合在一起。 我很高兴与大家分享我在回答足球界日益重要的问题上的过程-我们可以使用数据来预测达阵吗?
第1部分-目标 (Part 1— Objectives)
I had three primary objectives for this project. First, I wanted to use a classification model to classify touchdown plays versus non-touchdown plays. This was the prediction part. One really important thing I want to note, is that these are not predicting plays in the future. The model uses data it already has to make its predictions on data it’s never seen before. I’ll expand on this in a moment.
对于这个项目,我有三个主要目标。 首先,我想使用分类模型对触地得分与非触地得分进行分类。 这是预测部分。 我要指出的一件事是, 真正重要的是,这些都不是未来的预测。 该模型使用已经必须对之前从未见过的数据进行预测的数据。 稍后我将对此进行详细说明。
Second, I wanted to discover what the most important predictors (which I may also refer to as ‘features’) were for the machine in determining what separates a touchdown from a non-touchdown. Having this valuable information will allow me to achieve my third objective, which is to use all that I’ve learned to make data-driven recommendations for offensive and defensive coaches.
其次,我想发现对于机器而言,最重要的预测指标(我也可以称为“特征”)是什么,它决定了将触地得分与非触地得分区分开的因素。 拥有这些宝贵的信息将使我实现我的第三个目标,那就是利用我所学到的所有知识,为进攻型和防守型教练提供数据驱动的建议。
第2部分-数据 (Part 2— The Data)
For anyone interested, the dataset for this project can be found on Kaggle, here. There were a couple options to choose from, but I decided to use the play-by-play data from 2009–2017 so that I could have as much data as possible to work with. This set contains every single play, from every single game, for every single team, for all of the NFL Regular Season games that were played between the 2009 and 2017 seasons. So, there is no preseason or postseason included.
对于任何感兴趣的人,可以在Kaggle的此处找到该项目的数据集。 有两个选项可供选择,但我决定使用2009-2017年的逐次播放数据,以便可以使用尽可能多的数据。 这组包含2009年至2017赛季之间所有NFL常规赛比赛的每场比赛,每场比赛,每支球队的比赛。 因此,不包括季前赛或季后赛。
After going through the process of preprocessing and cleaning my data, I finished up with 7,068 predictors (columns) and 407,688 entries (rows) of data to work with. So in total, there were about 2.88 billion pieces of data. Some will say, “woah! that’s a lot!”, and others will say “meh. that’s nothin.” And to each their own. But in my experience, this was by far the largest dataset I have worked with. However, I viewed that as a good thing — more data should mean high-quality and highly reproducible results.
在完成预处理和清理数据的过程之后,我完成了7,068个预测变量(列)和407,688个数据条目(行)可以使用。 因此,总共有大约28.8亿条数据。 有人会说:“哇! 太多了!”,其他人会说“嗯。 那没什么。 并给每个人自己。 但是根据我的经验,这是迄今为止我使用过的最大的数据集。 但是,我认为这是一件好事-更多数据应意味着高质量和高度可重复的结果。
第3部分-建模 (Part 3 — Modeling)
Now that the data had been obtained and properly preprocessed, I could begin modeling. My first step was to determine my target variable, which was whether a play resulted in a touchdown or not (this column was a boolean — 0=False, meaning no touchdown, and 1=True, meaning a touchdown was scored.) Then, I performed a train-test split. I decided to use a 75% training/25% testing split. What this means is that the machine will learn (hence, ‘machine learning’) from 75% of the data on which predictors are most featured in both touchdown plays and non-touchdown plays (target variable). Then, the machine will use what it learned from its training process to make its predictions on the remaining 25% of the data that it has yet to see.
现在已经获得了数据并进行了适当的预处理,我可以开始建模了。 我的第一步是确定我的目标变量,这是一个游戏是否导致触地得分(此列为布尔值-0 = False,表示无触地得分,1 = True,表示触地得分。)然后,我进行了火车测试拆分。 我决定使用75%的培训/ 25%的测试分组。 这意味着机器将从75%的数据中学习(因此称为“机器学习”),预测值在触地得分比赛和非触地得分比赛(目标变量)中最有特色。 然后,机器将使用从训练过程中学到的知识对尚未看到的剩余25%数据做出预测。
*Quick Side Note* For anyone reading this that may be new to data science or machine learning, creating your target and performing a train-test split should always be your first two steps, no matter what kind of machine learning model you may be running.
*快速说明*对于任何可能不了解数据科学或机器学习的人,无论您正在运行哪种机器学习模型,创建目标和执行火车测试拆分始终应该是您的前两个步骤。
For this project, I decided to try two different types of ensemble methods, which were a decision trees model and a random forest model. A random forest is basically a bunch of different decision trees, and I figured that it would produce better results. Interestingly though, the decision trees model created much more meaningful and reliable results, and that is what I will display in this blog post.
对于这个项目,我决定尝试两种不同类型的集成方法,即决策树模型和随机森林模型。 随机森林基本上是一堆不同的决策树,我认为它将产生更好的结果。 但是,有趣的是,决策树模型创建了更有意义,更可靠的结果,这就是我将在此博客文章中显示的内容。
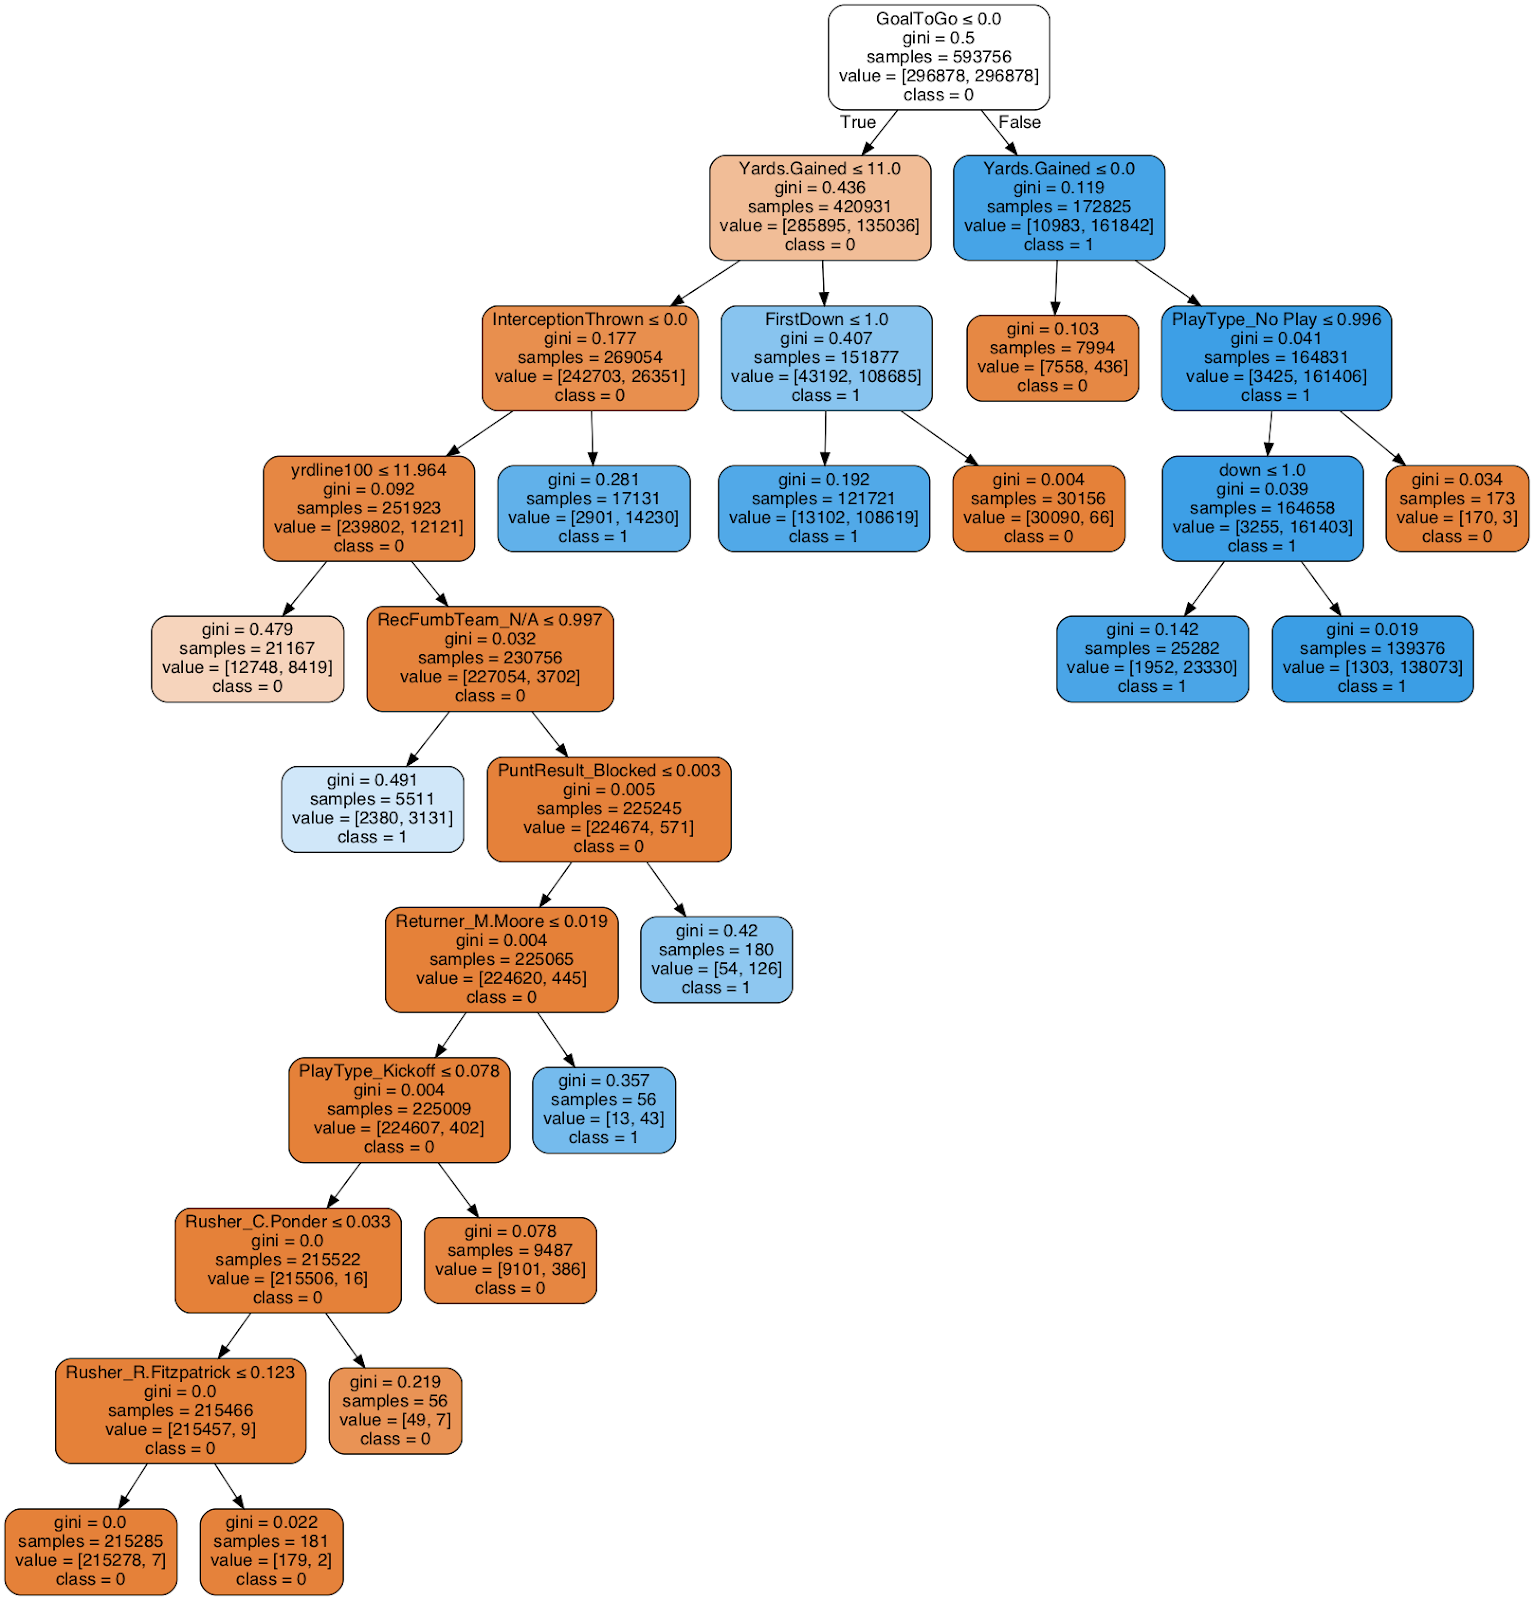
This is the actual decision tree from my project. Essentially, decision trees work by breaking down the samples of a particular set of data into smaller and smaller groups, which creates the tree-like structure you see above. The white box is known as the decision node, which is broken into a number of branches that is equal to the number of classes in your target variable. So, because there are two classes in my target, it is broken into two branches, 0 equaling False (non-touchdown) and 1 equaling True (touchdown). Then, each colored box is called a leaf node, which is a representation of the machine’s classification, or decision. So, the orange boxes represent plays that were not touchdowns, and the blue boxes represent plays that were touchdowns.
这是我项目中的实际决策树。 本质上,决策树通过将一组特定数据的样本分成越来越小的组来工作,从而创建了您在上面看到的树状结构。 白框称为决策节点 ,它分为多个分支,这些分支等于您的目标变量中的类数。 因此,由于目标中有两个类,因此将其分为两个分支,0等于False(非触地得分)和1等于True(触地得分)。 然后,每个有色框称为叶节点 ,它代表机器的分类或决策 。 因此,橙色框代表的不是触地得分,蓝色框代表的不是触地得分。
Typically, running a model with its vanilla features (or in other words, without tuning them) will result in suboptimal results. It is common to utilize something like GridSearchCV from sklearn to determine the optimal features. However, with the machine I have and the size of the dataset, GridSearch was too resource-heavy and proved to be inefficient. I instead used a smiliair tool called RandomizedSearchCV, which still took a while to run, but proved to be more efficient than GridSearch and the good old-fashioned trial & error method. In this model, I tuned two features: max_depth & min_samples_split.
通常,运行具有原始特征的模型(或者说,不对其进行调整)将导致结果欠佳。 通常使用sklearn中的GridSearchCV之类的东西来确定最佳功能。 但是,使用我拥有的计算机和数据集的大小,GridSearch太耗资源,因此效率低下。 相反,我使用了一个名为RandomizedSearchCV的辅助工具,该工具仍然需要一段时间才能运行,但事实证明它比GridSearch和老式的反复试验方法更有效。 在此模型中,我调整了两个功能:max_depth和min_samples_split。
max_depth determines the maximum depth of the tree. Normally, the tree will continue to diverge until all the leaves are fulfilled, or the leaves contain fewer than the min_samples_split parameter has designated. My max_depth was set to 10.
max_depth确定树的最大深度。 通常,树将继续发散,直到所有叶子都满足为止,或者叶子包含的数量少于min_samples_split参数指定的数量。 我的max_depth设置为10。
min_samples_split determines the minimum number of samples needed before breaking off into a new leaf node. This feature is cool because you can use a whole number of samples (aka an integer) or you can use a percentage of the samples (aka a float). The default value is 2… which, when working with almost 2.9 billion pieces of data, is going to do one of two things: One, create terrible results; Or two, create results that are so good, it’s almost impossible to believe. The latter happened to me. So, I set my min_samples_split to 0.25.
min_samples_split确定在分解为新的叶节点之前所需的最少样本数。 此功能很酷,因为您可以使用全部样本(也就是整数),也可以使用一定比例的样本(也就是浮点数)。 默认值为2…,当处理近29亿条数据时,它将执行以下两项操作之一: 或两个,创造出如此出色的结果,几乎是难以置信的。 后者发生在我身上。 因此,我将我的min_samples_split设置为0.25。
第4部分-结果 (Part 4 — Results)
Above, you will see my confusion matrix, which is a representation of how well the model did predicting touchdowns and non-touchdowns. The purple boxes are what is important to focus on because the top-left represents “true negatives”, which means correctly predicted non-touchdowns, and the bottom right represents “true positives”, which means correctly predicted touchdowns. Overall, the testing accuracy was 93%, which is excellent (and also believable!)
在上方,您将看到我的混淆矩阵,该矩阵表示模型预测着陆和非着陆的效果。 紫色框是需要重点关注的地方,因为左上角代表“真实否定”,这意味着正确预测的非触地得分,右下角代表“真实正向”,这意味着正确预测的触地得分。 总体而言,测试精度为93%,这非常好(也是令人信服的!)
For those that are curious, the random forest model that I ran with the same parameter tuning (max_depth & min_samples_split) predicted 90% of non-touchdowns correctly, only 55% of touchdowns correctly, and had an overall testing accuracy of 89%. Like I said in the intro, this definitely was a surprise to me.
对于那些好奇的人,我使用相同的参数调整(max_depth和min_samples_split)运行的随机森林模型正确地预测了90%的非触地得分,正确地预测了55%的非触地得分,并且总体测试准确性为89%。 就像我在介绍中所说的那样,这绝对让我感到惊讶。
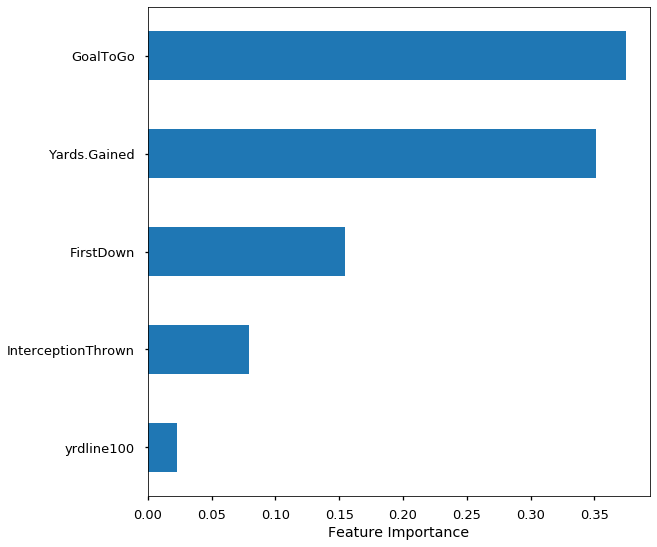
Objective #1 has been achieved, so now we’re on to objective #2: what are the important features? So, remember how I said that there were 7,068 features for the machine to learn from? Well, it turns out that there were only 5 — yes, five — that really mattered. That’s .0007% of the features. Woah! Of these five features, two had positive influences on touchdowns and three had negative influences on touchdowns:
目标1已经实现,所以现在我们进入目标2: 重要特征是什么? 因此,还记得我说过要为机器学习的7,068项功能吗? 好吧,事实证明只有5个-是的, 五个 -确实很重要。 这就是功能的0.007%。 哇! 在这五个功能中,两个对触地得分有正面影响,三个对触地得分有负面影响:
Goal To Go — Was the ball placed on the opponents 10 yard line or closer? Influence: Positive. It’s much easier to score from 10 yards out than 90 yards out.
要进球 –球是放在对手10码线上或更近的位置上吗? 影响: 积极 。 从10码以外的地方得分比90码以外的地方容易得多。
Yards Gained — Did the offense gain positive yardage? Influence: Positive. Gaining positive yardage means you’re moving in the right direction, thus increasing the chance to score a touchdown.
乱码 —进攻是否获得了正码数? 影响: 积极 。 获得正码数意味着您朝着正确的方向前进,从而增加了达阵得分的机会。
First Down — Did the play result in a first down? Influence: Negative. Gaining first downs is a good thing for an offense. However, a play ruled as a touchdown is not also considered a first down. Therefore, you can’t have a touchdown and a first down on the same play.
第一回合 -比赛是否导致第一回合? 影响: 负面 。 获得先攻是对进攻的好事。 但是,被视为触地得分的比赛也不会被视为首发。 因此,您不能在同一场比赛中触地得分和先击球。
Interception Thrown — Was there an interception thrown on the play? Influence: Negative. On offense, if you turn the ball over, you can’t score. One thing I find interesting is that fumbles weren’t nearly as important as interceptions were.
拦截拦截 -剧中是否有拦截? 影响: 负面 。 进攻时,如果您将球翻过来,就无法得分。 我发现有趣的一件事是,骗局并不像拦截一样重要。
Yard Line (100) — Imagine the field being one 100 yard field, as opposed to two 50 yard halves. The 1 would be the offense’s one yard line, the 50 would be midfield, and the 99 would be the opponent’s one yard line. Where is the ball on the field? Influence: Negative. This is kind of the opposite of Goal to Go, in a sense. Most offensive plays happen on the offense’s own side of the field, let alone inside their opponent’s 10 yard line. The more distance needed, the harder it is to score.
码线(100) -假设该字段是一个100码的字段,而不是两个50码的一半。 1是进攻方的一码线,50是中场,而99是对手的一码线。 球场上的球在哪里? 影响: 负面 。 从某种意义上讲,这与“ Goal to Go”相反。 大多数进攻战术发生在进攻方自己的领域,更不用说在对手的10码线内了。 需要的距离越长,得分就越困难。
第5部分-数据驱动的建议 (Part 5 — Data-Driven Recommendations)
Now that we have all of these fantastic insights, how can this information be applied? I believe that the group that would most benefit from this analysis would be coaches, both on offense and on defense.
既然我们拥有所有这些奇妙的见解,那么如何应用这些信息? 我相信从分析中受益最大的是教练,无论是进攻还是防守。
进攻教练 (Offensive Coaches)
Get big plays, but don’t get carried away — We’ve seen that gaining positive yardage has a positive influence on being able to score touchdowns. However, that doesn’t mean you need to go bombs away every play. Scout the defense, attack their weaknesses, and move the ball downfield. Typically, more yards equals more points.
发挥重要作用,但不要束手无策 —我们已经看到,获得正码数对能够触地得分有积极影响。 但是,这并不意味着您每次玩都需要炸掉炸弹。 侦察防守,攻击他们的弱点,并将球移至低位。 通常,更多的码等于更多的点。
When you’re in the money zone, you got to make a deposit! — If you get the ball inside your opponent’s 10 yard line, you gotta score. Period. Inside the 10 is your easiest chance to score because of the short distance, so you got to take advantage of those opportunities when they present themselves.
当您处于货币区时,您必须进行存款! —如果将球传到对手10码线内,您就可以得分。 期。 十杆之内是最容易得分的机会,这是因为距离很短,所以当他们展现自己时,您必须利用这些机会。
Limit turnovers, especially interceptions — You can’t score if you don’t have the ball. That’s good old-fashioned football 101 right there. Personally, I believe interceptions have a much stronger negative influence than fumbles because interceptions tend to be returned for more yards than fumbles do. This correlates with the Yard Line (100) feature explained above, in that the closer your offense can be to your opponent’s end zone, the easier it will be to score.
限制失误,尤其是拦截 -如果没有球,就无法得分。 那就是那辆不错的老式足球101。 就我个人而言,我认为拦截比骗局具有更大的负面影响,因为拦截往往比骗局返回更多码。 这与上文所述的“围场线(100)”特征相关,因为您的进攻越接近对手的终点区域,得分就越容易。
防守教练 (Defensive Coaches)
Use controlled, precise aggression to force interceptions — Defensive players love playing defense because they love to hit people! But, so many times we have seen defenses get burned for big plays when they are too aggressive. You want to put pressure on the offense so that you can force bad decisions, poor execution, and turnovers (ahem, interceptions). Offenses are throwing the ball more than ever, so there are plenty of opportunities to force quarterbacks into making mistakes.
使用可控的,精确的进攻来强制拦截 -防守球员喜欢打防守,因为他们喜欢打人! 但是,很多时候我们都看到,防守过于激进时,他们的防守就会被大打大闹。 您想对进攻施加压力,以便您可以做出错误的决定,执行不力和失误(糟糕,拦截)。 进攻比以往任何时候都更为重要,因此有很多机会迫使四分卫犯错。
Limit yardage — I know, duh, right? That’s the defense’s job. But, the data verifies how important this is. Just like how on offense there is a positive correlation between yards gained and touchdowns scored, the same effect is felt in the opposite direction. If you limit how many yards the offense gains, you control where the ball is on the field, and you will limit the amount of touchdowns the offense can score.
限制码数 -我知道,对不对? 那是国防部的工作。 但是,数据验证了这一点的重要性。 就像在进攻端获得的码数和触地得分之间有正相关关系一样,在相反的方向上也能感觉到相同的效果。 如果您限制进攻获得多少码,则可以控制球在场上的位置,并且可以限制进攻得分的触地得分数量。
结论 (Conclusion)
I had so much fun working on this project. I have always been a nerd for football stats, and I think it’s truly amazing that we have technology now where we can use that statistical information to create high-value insights in order to increase performance. At the end of the day, it is up to both the coaches and the players to execute their game-plan against their opponent. But, taking advantage of technology and knowledge like this to create the best gameplan possible will create the ultimate advantage. I hope you enjoyed reading! Go Vikings!
我在这个项目上工作非常有趣。 我一直是足球统计专家的书呆子,我认为我们拥有现在可以使用统计信息来创造高价值洞察力以提高绩效的技术确实令人惊讶。 归根结底,教练和球员都必须执行对对手的比赛计划。 但是,利用这样的技术和知识来创造最佳的游戏计划将创造最终的优势。 希望您喜欢阅读! 去维京人!
#Skol
#斯科尔

使用机器学习预测天气


 4351
4351


 被折叠的 条评论
为什么被折叠?
被折叠的 条评论
为什么被折叠?
 到【灌水乐园】发言


