


熊猫数据集
Have you ever dealt with a dataset that required you to work with list values? If so, you will understand how painful this can be. If you have not, you better prepare for it.
您是否曾经处理过需要使用列表值的数据集? 如果是这样,您将了解这会是多么痛苦。 如果没有,则最好做好准备。
If you look closely, you will find that lists are everywhere! Here are some practical problems, where you will probably encounter list values.
如果仔细观察,您会发现列表无处不在! 这是一些实际问题,您可能会在其中遇到列表值。
- Audio- or video tags 音频或视频标签
- Open-ended questions in survey data 调查数据中的开放式问题
- Lists of all authors, artists, producers, etc. involved in a creative product 涉及创意产品的所有作者,艺术家,制作人等的列表
I have recently worked on multiple projects that required me to analyze this kind of data. After many painful hours of figuring out how to perform even the simplest operations, I realized had to share my knowledge here to save you some time.
我最近参与了多个项目,这些项目需要我分析此类数据。 经过数小时的辛苦工作,弄清楚如何执行最简单的操作后,我意识到必须在这里分享我的知识,以节省您一些时间。
I will show you the kinds of problems you might encounter and offer practical solutions for them.
我将向您展示您可能遇到的各种问题,并为他们提供实用的解决方案。
快速准备 (Quick Preparation)
To follow this tutorial, feel free to download the fictional dataset used for all the examples. All materials including the code can be found in this repo.
要遵循本教程,请随时下载用于所有示例的虚构数据集。 所有材料(包括代码)都可以在此仓库中找到。
Also, please import all the necessary libraries and load the dataframe.
另外,请导入所有必需的库并加载数据框。
import pandas as pd
import numpy as np
import matplotlib as pltfruits = pd.read_csv("fruits.csv", delimiter = ";")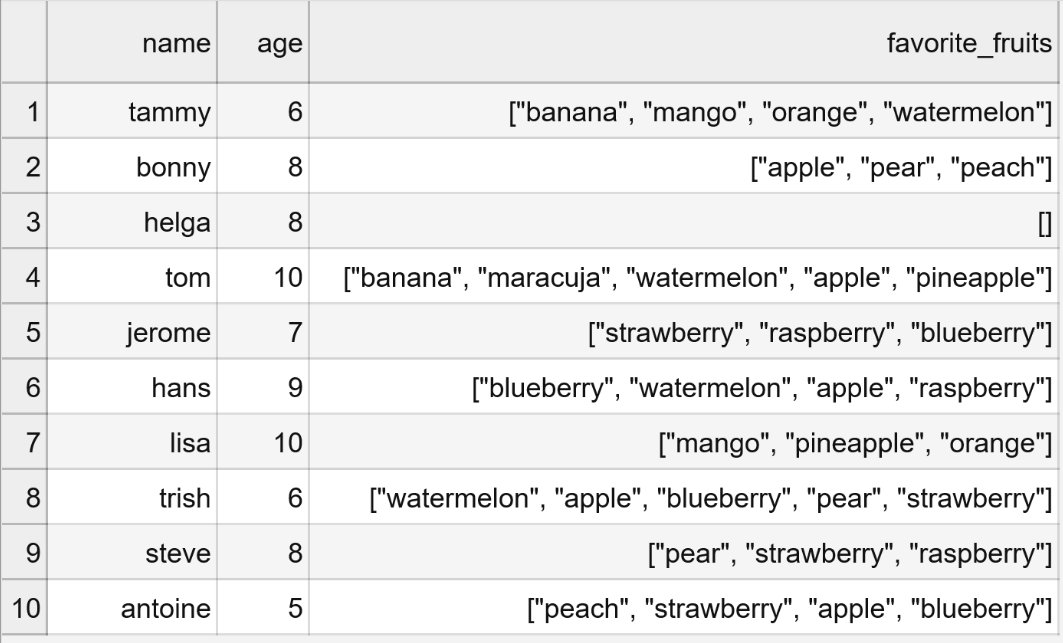
列表值到底有什么问题? (What Is Even Wrong with List Values?)
Allow me to get right to the point: List values mess up everything you know about data analysis. The simplest operations can not be performed without endless looping. Let me show you a quick example:
请允许我说清楚:列表值弄乱了您对数据分析的了解。 没有无穷循环,就无法执行最简单的操作。 让我给你看一个简单的例子:
For the “age” column in the example dataset, we can easily use the value_counts() function to count how many times which age was observed.
对于示例数据集中的“年龄”列,我们可以轻松地使用value_counts()函数来计算观察到多少年龄。
fruits["age"].value_counts()## OUTPUT ##
8     3
10    2
6     2
9     1
7     1
5     1
What if we want to find out which fruits were named the most? In principle, we have all the data we need for this in the “favorite_fruits” column. However, if we apply the same function, the results are less than unhelpful.
如果我们想找出哪种水果被命名最多,该怎么办? 原则上,我们在“ favorite_fruits”列中拥有为此所需的所有数据。 但是,如果我们应用相同的功能,结果将无济于事。
fruits["favorite_fruits"].value_counts()## OUTPUT ##
["strawberry", "raspberry", "blueberry"]                      1
["mango", "pineapple", "orange"]                              1
["blueberry", "watermelon", "apple", "raspberry"]             1
["apple", "pear", "peach"]                                    1
["pear", "strawberry", "raspberry"]                           1
["banana", "maracuja", "watermelon", "apple", "pineapple"]    1
["peach", "strawberry", "apple", "blueberry"]                 1
[]                                                            1
["banana", "mango", "orange", "watermelon"]                   1
["watermelon", "apple", "blueberry", "pear", "strawberry"]    1
The reason this does not work is that Pandas does not have direct access to every individual element of the lists. Thus, Pandas is unable to apply functions like value_counts() properly. So, what do we do instead? I will show you in the following!
这样做不起作用的原因是,熊猫无法直接访问列表中的每个单独元素。 因此,Pandas无法正确应用诸如value_counts()之类的功能。 那么,我们该怎么做呢? 我将在下面向您展示!
问题1:我的列表存储为字符串 (Problem 1: My Lists are Stored as Strings)
One problem you will always encounter is that Pandas will read your lists as strings, not as lists.
您将永远遇到的一个问题是,熊猫将以字符串而不是列表的形式读取列表。
for i, l in enumerate(fruits["favorite_fruits"]):
    print("list",i,"is",type(l))## OUTPUT ##
list 0 is <class 'str'>
list 1 is <class 'str'>
list 2 is <class 'str'>
list 3 is <class 'str'>
list 4 is <class 'str'>
list 5 is <class 'str'>
list 6 is <class 'str'>
list 7 is <class 'str'>
list 8 is <class 'str'>
list 9 is <class 'str'>
This means that you can not even loop through the lists to count unique values or frequencies. Depending on how your lists are formatted in the dataframe, there is an easy or a more complex solution. In any case, you will simply be able to use the code I provide.
这意味着您甚至无法遍历列表来计算唯一值或频率。 根据数据框中列表的格式,有一个简单或更复杂的解决方案。 无论如何,您都可以使用我提供的代码。
您的字符串看起来像这样:“ ['草莓','苹果','橙色']”吗? (Do your strings look like this: “[‘strawberry’, ‘apple’, ‘orange’]”?)
In that case, there is a quick method using the apply() and eval() functions.
在这种情况下,有一种使用apply()和eval()函数的快速方法。
fruits["favorite_fruits"] = fruits["favorite_fruits"].apply(eval)您的字符串看起来像这样:“ [草莓,苹果,橙子]”吗? (Do your strings look like this: “[strawberry, apple, orange]”?)
This one is tougher, because the eval() function will not work, as the list is lacking the inner quotation marks in order for it to be recognized as a list object. The quick and dirty solution is to simply add the quotation marks to the string and apply eval() afterwards. Use this function:
这一点比较困难,因为eval()函数将不起作用,因为列表缺少内部引号以便将其识别为列表对象。 快速而肮脏的解决方案是简单地在字符串中添加引号,然后再应用eval() 。 使用此功能:
def clean_alt_list(list_):
    list_ = list_.replace(', ', '","')
    list_ = list_.replace('[', '["')
    list_ = list_.replace(']', '"]')
    return list_
To apply this to your dataframe, use this pseudo code:
要将其应用于您的数据框,请使用以下伪代码:
df[col] = df[col].apply(clean_alt_list)Note that in both cases, Pandas will still assign the series an “O” datatype, which is typically used for strings. But do not let this confuse you. You can check the actual datatype using:
请注意,在两种情况下,Pandas仍将为系列分配“ O”数据类型,该数据类型通常用于字符串。 但是,不要让这让您感到困惑。 您可以使用以下方法检查实际的数据类型:
for i, l in enumerate(fruits[“favorite_fruits”]):
 print(“list”,i,”is”,type(l))## OUTPUT ##
list 0 is <class 'list'>
list 1 is <class 'list'>
list 2 is <class 'list'>
list 3 is <class 'list'>
list 4 is <class 'list'>
list 5 is <class 'list'>
list 6 is <class 'list'>
list 7 is <class 'list'>
list 8 is <class 'list'>
list 9 is <class 'list'>
问题2:获取唯一值或值计数 (Problem 2: Getting Unique Values or Value Counts)
After this first step, our lists are finally recognized as such by Pandas. Still, we can not use the standard functions, because they are not made for list applications.
迈出第一步之后,熊猫终于承认了我们的名单。 但是,我们仍然不能使用标准功能,因为它们不是为列表应用程序而设计的。
At least we could use loops for everything now. This method works with small datasets, but can get awfully slow with large ones. For example, I had to analyze taglists of up to 999 tags for around 500k music tracks. This means, that the inner loop would have had hundreds of millions of iterations, which would have taken many hours and probably crashed my computer. I will show you a cleaner and quicker way to do this in a minute. However, if you really want to use loops, here is the code:
至少我们现在可以对所有内容使用循环。 此方法适用于小型数据集,但适用于大型数据集会变得非常慢。 例如,我不得不分析多达500个音乐曲目的多达999个标签的标签列表。 这意味着,内部循环将进行数亿次迭代,这将花费许多小时,并且可能使我的计算机崩溃。 我将在一分钟内为您展示一种更清洁,更快捷的方法。 但是,如果您真的想使用循环,请使用以下代码:
fruit_dict = {}
for i in fruits["favorite_fruits"]:
    for j in j:
        if j not in fruit_dict:
            fruit_dict[j] = 1
        else:
            fruit_dict[j] += 1
Here is the clean way that took me a while to figure out. If we conceptualize the favorite_fruits column as a 2D array, reducing its dimensions from 2 to 1 would allow us to apply the typical pandas functions again. For that, you can use this function:
这是我花了一段时间才弄清楚的干净方法。 如果将favourite_fruits列概念化为2D数组,则将其尺寸从2减小到1将允许我们再次应用典型的pandas函数。 为此,您可以使用以下功能:
def to_1D(series):
 return pd.Series([x for _list in series for x in _list])
If we use value_counts() now, we get the results we want.
如果现在使用value_counts() ,我们将获得所需的结果。
to_1D(fruits[“favorite_fruits”]).value_counts()## OUTPUT ##
apple         5
blueberry     4
watermelon    4
strawberry    4
raspberry     3
pear          3
banana        2
pineapple     2
mango         2
peach         2
orange        2
maracuja      1
To get unique values, just extract them from the results above chaining .index() onto it.
要获取唯一值,只需将.index()链接到上面的结果中即可将它们提取出来。
At this point, we can produce our first meaningful visualization.
在这一点上,我们可以产生第一个有意义的可视化。
fig, ax = plt.subplots(figsize = (14,4))
ax.bar(to_1D(fruits["favorite_fruits"]).value_counts().index,
        to_1D(fruits["favorite_fruits"]).value_counts().values)
ax.set_ylabel("Frequency", size = 12)
ax.set_title("Children's Favorite Fruits", size = 14)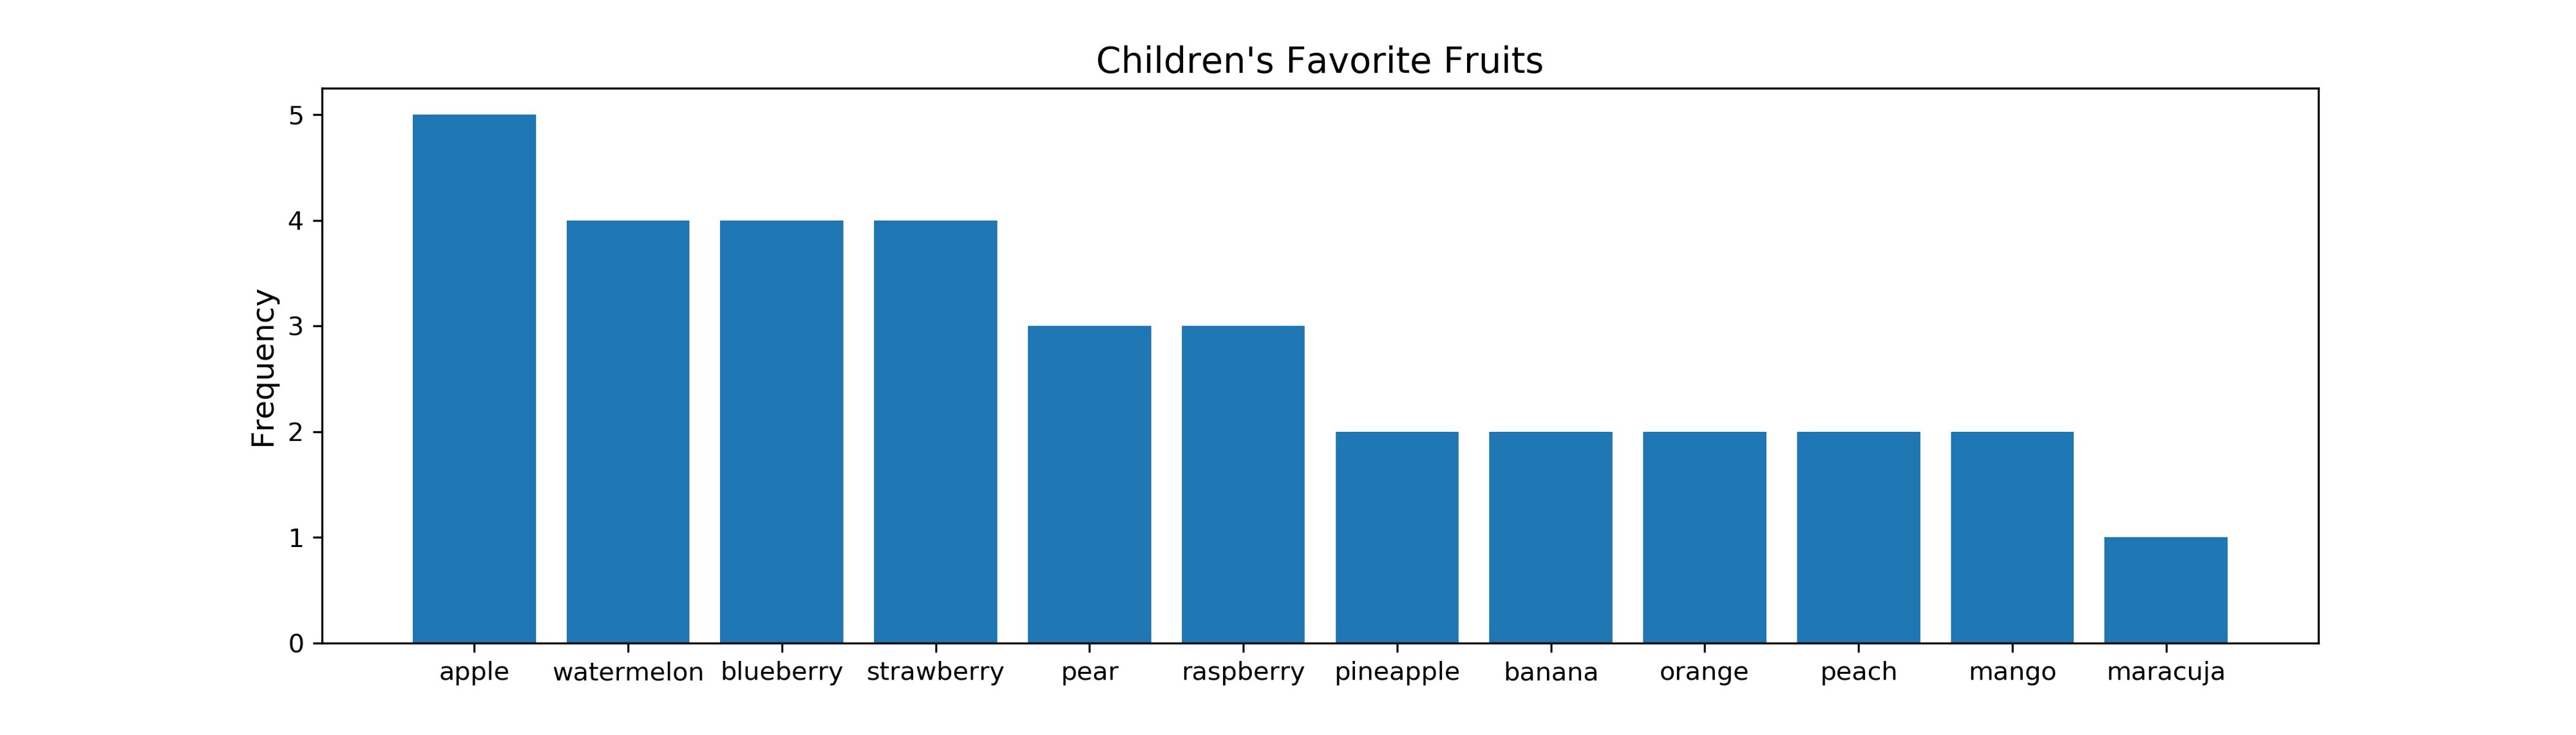
问题3:所有唯一值的单独列 (Problem 3: Individual Columns for All Unique Values)
At this point, things are getting advanced. If you are happy with the results we got before, you can stop here. However, a deeper level of analysis might be required for your research goal. Maybe you want to correlate all list elements with each other to compute similarity scores. E.g. do kids who eat bananas typically also like mangos? Or maybe you want to find out which fruit has been ranked as the top favorite fruit by the most kids. These questions can only be answered at a deeper level of analysis.
在这一点上,事情正在发展。 如果您对我们之前获得的结果感到满意,可以在这里停止。 但是,您的研究目标可能需要更深层次的分析。 也许您想将所有列表元素相互关联以计算相似性得分。 例如,吃香蕉的孩子通常也喜欢芒果吗? 或者,也许您想找出哪种水果被大多数孩子评为最喜欢的水果。 这些问题只能在更深层次的分析中得到回答。
For this, I will introduce two useful methods. They differ in complexity, but also in what you can do with their results.
为此,我将介绍两种有用的方法。 它们的复杂性不同,但是您可以如何处理它们的结果。
方法1 (Method 1)
This is a shockingly easy and fast method I stumbled upon. And it is so useful! All you need is one line of code.
这是我偶然发现的一种非常简单快捷的方法。 它是如此有用! 您只需要一行代码。
fruits_expanded_v1 = fruits["favorite_fruits"].apply(pd.Series)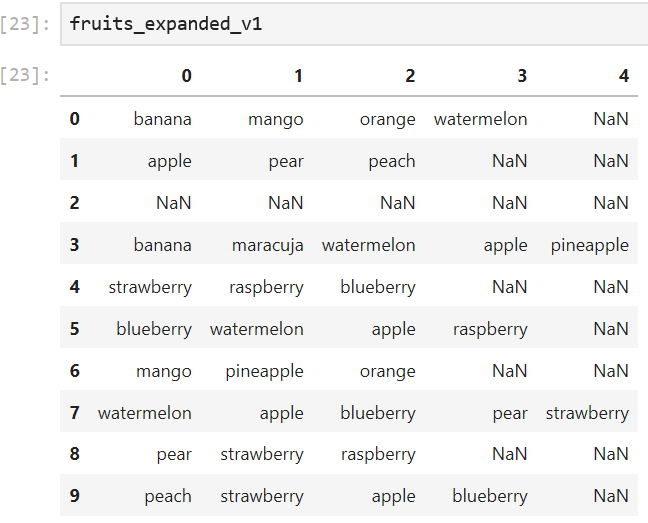
As you can see, this one-liner produced a dataframe where every list is split into its single elements. The columns indicate the order, in which the fruit was placed in the list. With this method, you will always get a dataframe with a shape of (n, len(longest_list)). In this case, two of the 10 children named five favorite fruits, which results a 10x5 dataframe.
如您所见,这种单行代码产生了一个数据框,其中每个列表都被拆分为单个元素。 列指示将水果放置在列表中的顺序。 使用此方法,您将始终获得形状为(n,len(longest_list))的数据框。 在这种情况下,10个孩子中的2个命名了5个最喜欢的水果,其结果为10x5数据帧。
Using this, we can find out which fruit was named most often as the number one favorite fruit.
使用此工具,我们可以找出哪种水果最常被称为最喜欢的水果之一。
fruits_expanded_v1.iloc[:,0].value_counts(normalize = True)## OUTPUT ##
banana        0.222222 pear          0.111111 watermelon    0.111111 blueberry     0.111111 strawberry    0.111111 apple         0.111111 peach         0.111111 mango         0.111111
We can see that bananas are most often kids’ absolute favorite fruit.
我们可以看到香蕉是孩子们最喜欢的水果。
Alternatively, we could target single fruits and find out how many times they were named at each position of the lists. This is the function I wrote for that:
或者,我们可以定位单个水果,并找出它们在列表的每个位置被命名了多少次。 这是我为此编写的功能:
def get_rankings(item, df):
    # Empty dict for results
    item_count_dict = {}
    # For every tag in df
    for i in range(df.shape[1]):
        # Calculate % of cases that tagged the item
        val_counts = df.iloc[:,i].value_counts(normalize = True)
        if item in val_counts.index:
            item_counts = val_counts[item]
        else:
            item_counts = 0
        # Add score to dict
        item_count_dict["tag_{}".format(i)] = item_counts
    return item_count_dict
If we apply it, we get:
如果我们应用它,我们将得到:
get_rankings(item = "apple", df = fruits_expanded_v1)## OUTPUT ##
{'tag_0': 0.1111111111111111,  'tag_1': 0.1111111111111111,  'tag_2': 0.2222222222222222,  'tag_3': 0.2,  'tag_4': 0}
As you can see, we can perform rank-based analyses very well with this approach. However, this method is near useless for other approaches. Because the columns do not represent a single tag, but a rank, most tag-based operations can not be done properly. For example, calculating the correlation between bananas and peaches is not possible with the dataframe we got from method 1. If that is your research goal, use the next method.
如您所见,我们可以使用这种方法很好地执行基于排名的分析。 但是,该方法对于其他方法几乎没有用。 由于这些列不代表单个标签,而是一个等级,因此大多数基于标签的操作无法正确完成。 例如,使用我们从方法1获得的数据框,不可能计算香蕉和桃子之间的相关性。如果这是您的研究目标,请使用下一种方法。
方法2 (Method 2)
This method is more complex and requires more resources. The idea is that we create a dataframe where rows stay the same as before, but where every fruit is assigned its own column. If only kid #2 named bananas, the banana column would have a “True” value at row 2 and “False” values everywhere else (see Figure 6). I wrote a function that will perform this operation. It relies on looping, which means that it will take lots of time with large datasets. However, out of all the methods I tried, this was the most efficient way to do it.
此方法更复杂,并且需要更多资源。 我们的想法是,我们创建一个数据框,其中的行与以前相同,但是每个水果都被分配了自己的列。 如果只有#2孩子命名为香蕉,那么香蕉列的第2行将具有“ True”值,而其他所有地方将具有“ False”值(参见图6)。 我写了一个函数来执行此操作。 它依赖于循环,这意味着大型数据集将花费大量时间。 但是,在我尝试过的所有方法中,这是最有效的方法。
def boolean_df(item_lists, unique_items):# Create empty dict
    bool_dict = {}
    # Loop through all the tags
    for i, item in enumerate(unique_items):
        # Apply boolean mask
        bool_dict[item] = item_lists.apply(lambda x: item in x)
    # Return the results as a dataframe
    return pd.DataFrame(bool_dict)
If we now apply the function
如果我们现在应用该功能
fruits_bool = boolean_df(fruits[“favorite_fruits”], unique_items.keys())we get this dataframe:
我们得到以下数据框:
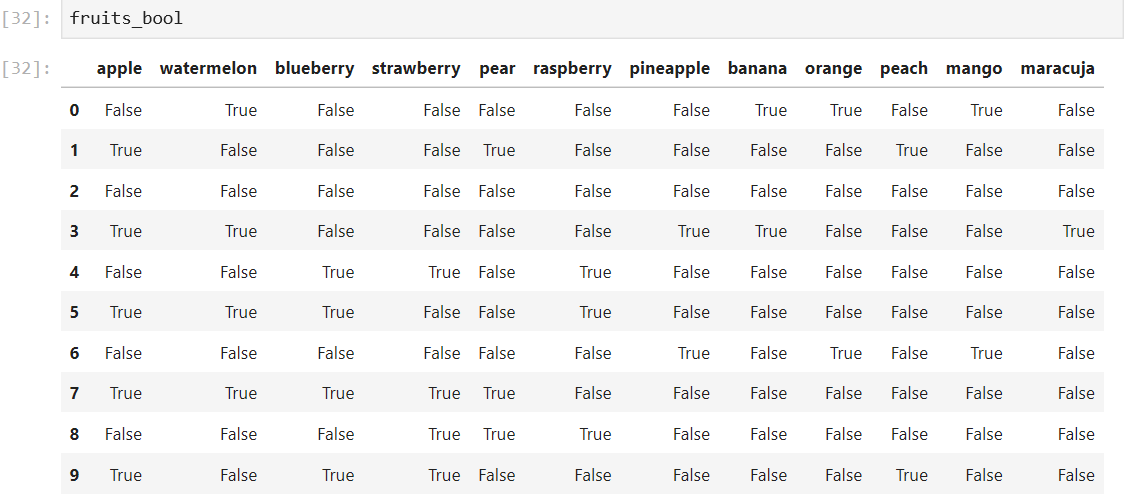
From here, we can easily calculate correlations. Note that “correlation” is not really the correct term, because we are not using metric or ordinal, but binary data. If you want to be correct, use “association”. I will not.
从这里,我们可以轻松地计算相关性。 请注意,“相关性”并不是真正正确的术语,因为我们不是在使用度量或序数,而是二进制数据。 如果您想正确,请使用“关联”。 我不会。
Again, there are multiple ways to correlate the fruits. One straight forward way is the Pearson correlation coefficient, which can also be used for binary data. Pandas has a built-int function for this.
同样,有多种关联水果的方法。 一种直接的方法是皮尔逊相关系数,该系数也可用于二进制数据。 熊猫为此提供了内置功能。
fruits_corr = fruits_bool.corr(method = "pearson")
Another way is to simply count how many times a fruit was named alongside all other fruits. This can be solved using matrix multiplication. For this, we will need to convert the boolean dataframe to an integer based on first.
另一种方法是简单地计算一个水果与所有其他水果一起命名的次数。 这可以使用矩阵乘法来解决。 为此,我们将需要基于first将布尔数据帧转换为整数。
fruits_int = fruits_bool.astype(int)Then, we can calculate the frequencies.
然后,我们可以计算频率。
fruits_freq_mat = np.dot(fruits_int.T, fruits_int)## OUTPUT ##array([[5, 3, 3, 2, 2, 1, 1, 1, 0, 2, 0, 1],
       [3, 4, 2, 1, 1, 1, 1, 2, 1, 0, 1, 1],
       [3, 2, 4, 3, 1, 2, 0, 0, 0, 1, 0, 0],
       [2, 1, 3, 4, 2, 2, 0, 0, 0, 1, 0, 0],
       [2, 1, 1, 2, 3, 1, 0, 0, 0, 1, 0, 0],
       [1, 1, 2, 2, 1, 3, 0, 0, 0, 0, 0, 0],
       [1, 1, 0, 0, 0, 0, 2, 1, 1, 0, 1, 1],
       [1, 2, 0, 0, 0, 0, 1, 2, 1, 0, 1, 1],
       [0, 1, 0, 0, 0, 0, 1, 1, 2, 0, 2, 0],
       [2, 0, 1, 1, 1, 0, 0, 0, 0, 2, 0, 0],
       [0, 1, 0, 0, 0, 0, 1, 1, 2, 0, 2, 0],
       [1, 1, 0, 0, 0, 0, 1, 1, 0, 0, 0, 1]])
All we need to do now is add labels and transform it back to a dataframe.
现在我们要做的就是添加标签并将其转换回数据框。
fruits_freq = pd.DataFrame(fruits_freq_mat, columns = unique_items.keys(), index = unique_items.keys())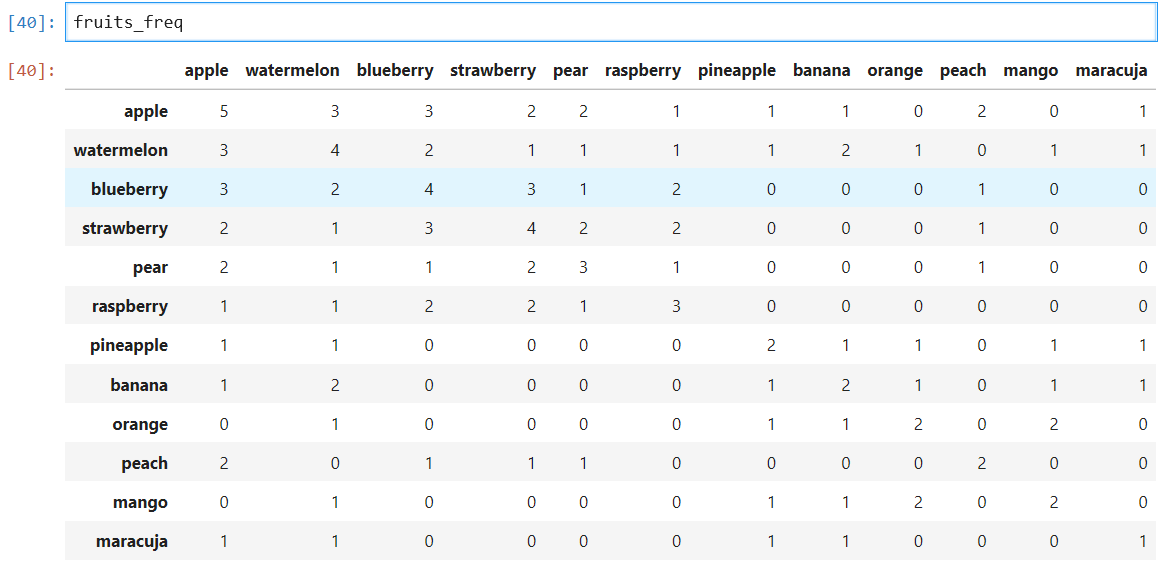
If you are looking for a nice visualization, you can create a heatmap with the seaborn library.
如果您正在寻找不错的可视化效果,则可以使用seaborn库创建一个热图。
import seaborn as snfig, ax = plt.subplots(figsize = (9,5))
sn.heatmap(fruits_freq, cmap = "Blues")
plt.xticks(rotation=50)
plt.savefig("heatmap.png", dpi = 300)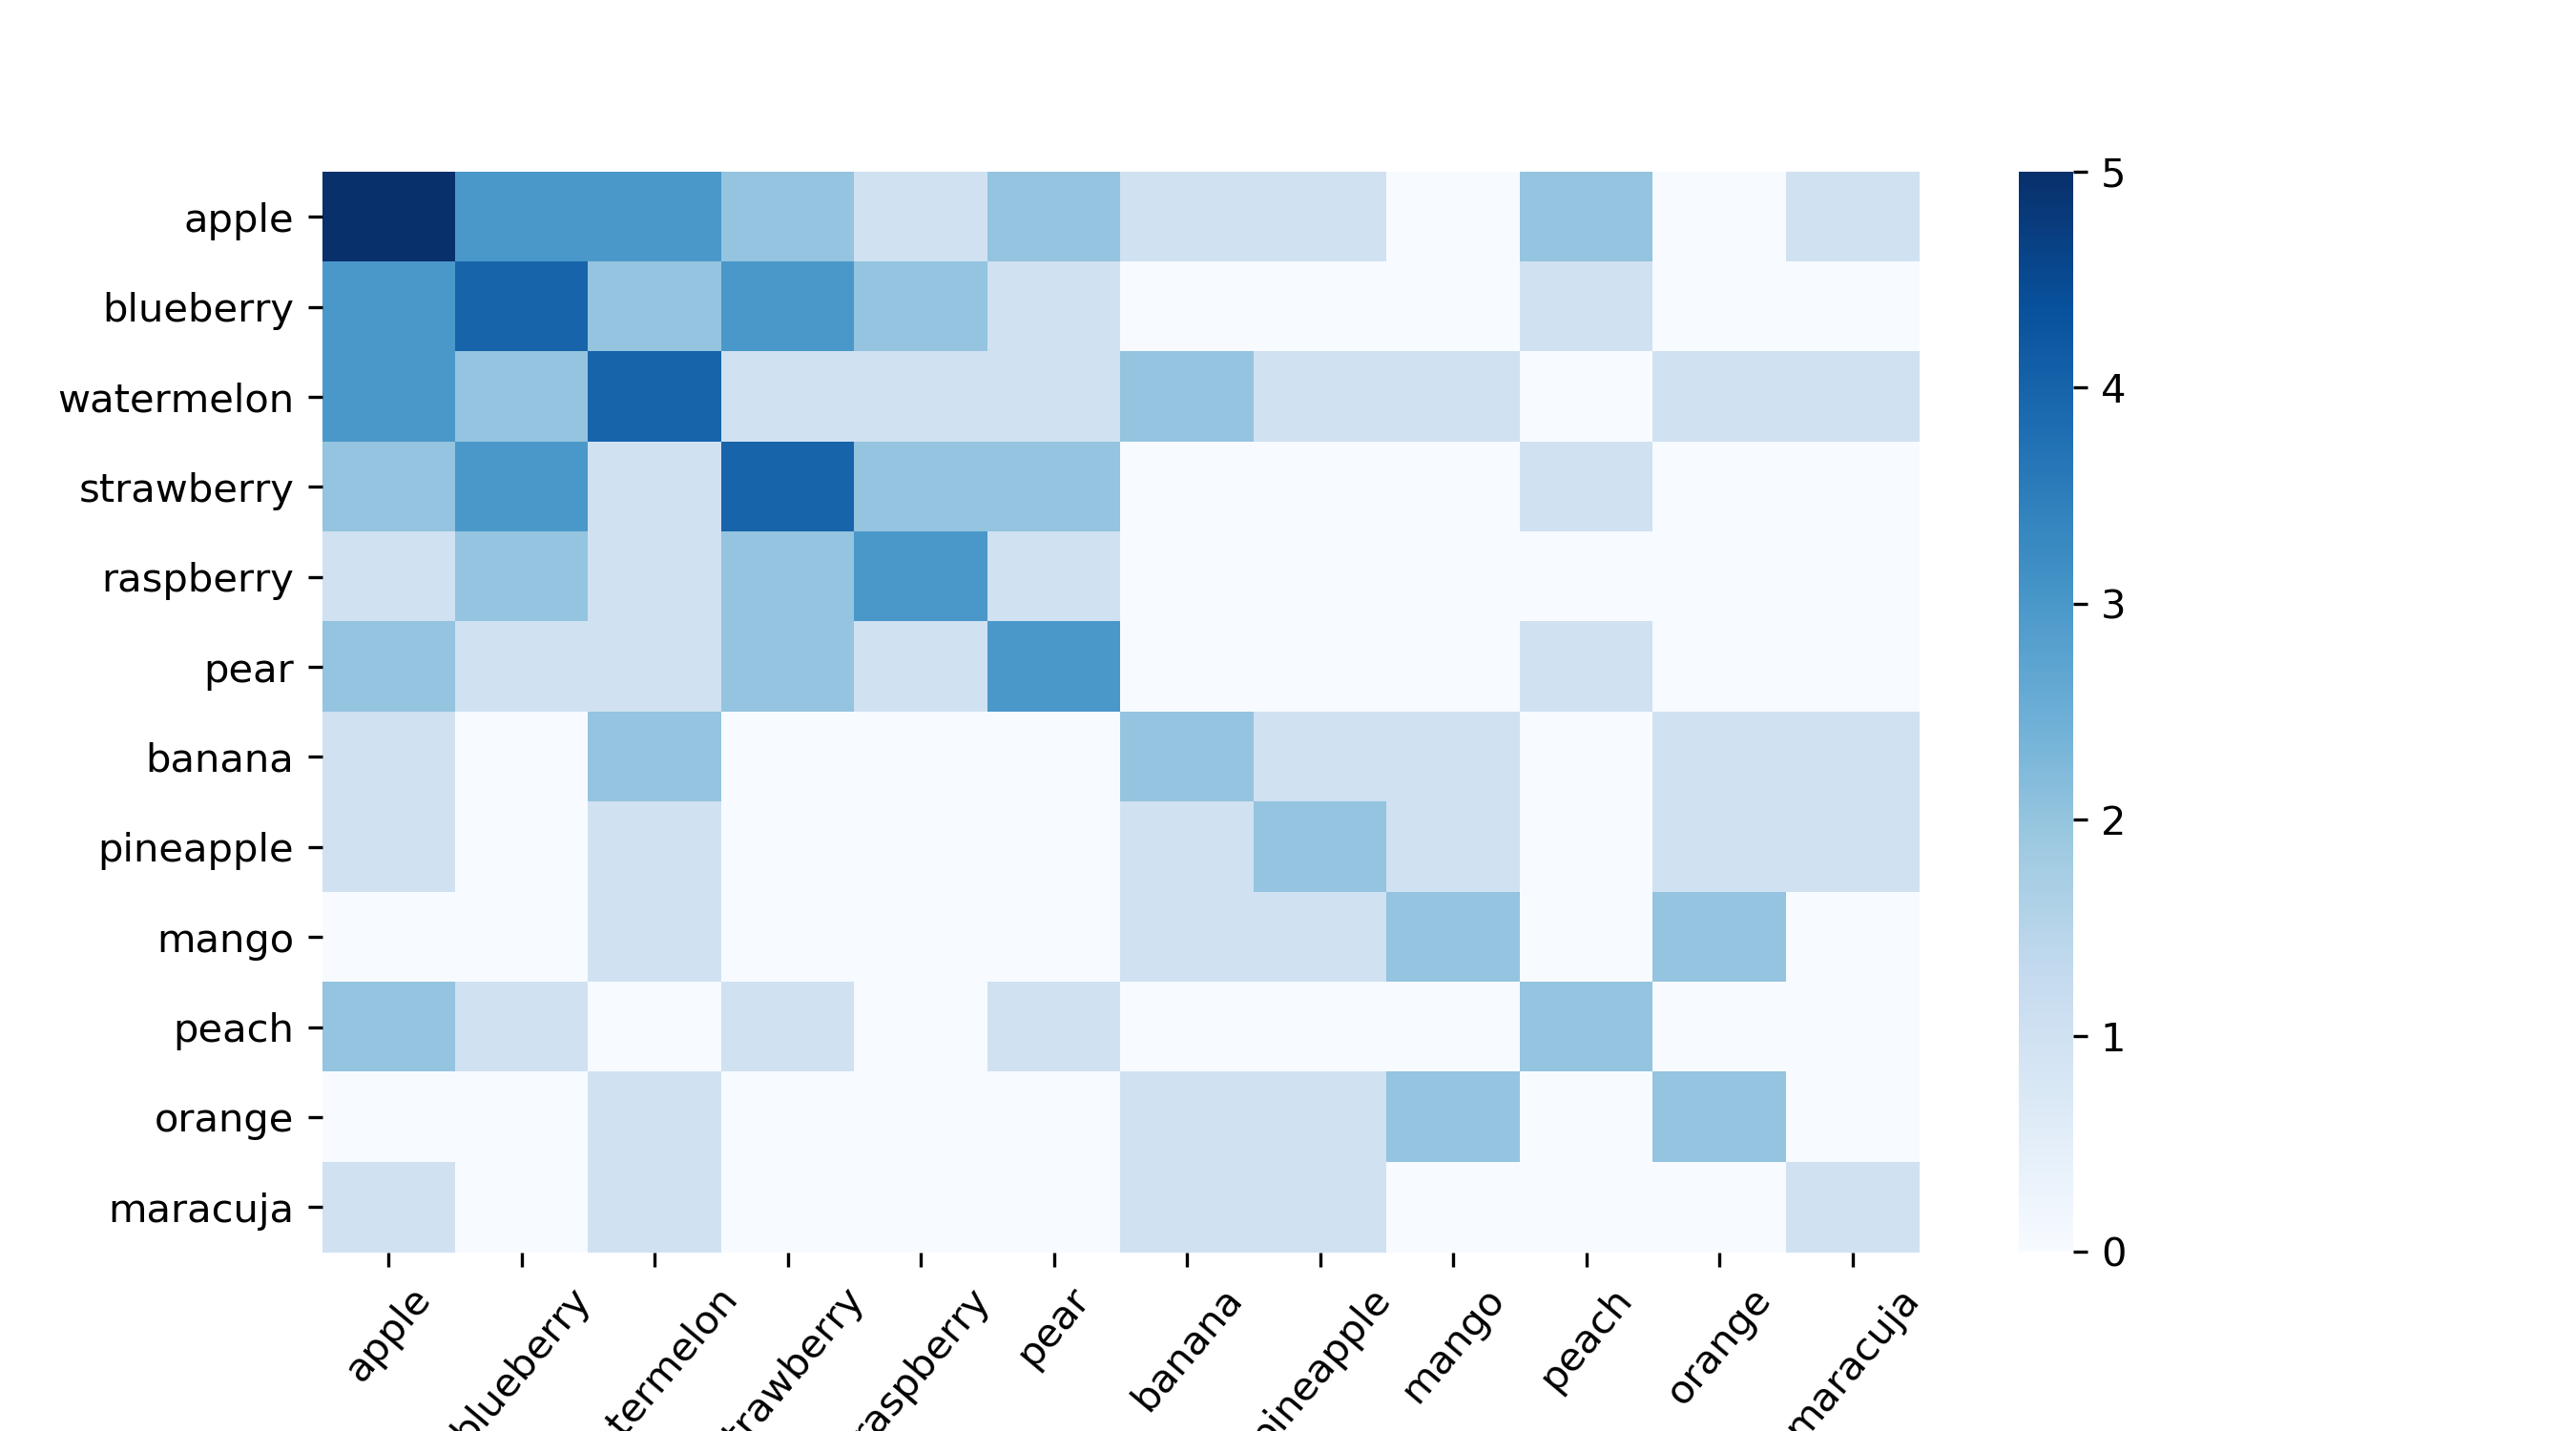
With the Pearson matrix, we can easily build a fruit recommender system. For example, if you input that you like bananas, it will recommend you a maracuja, because those two have the highest correlation (0.67). You will be surprised by how powerful this simple approach is. I have used it successfully multiple times. If you want to do something like this with the frequency dataframe, you need to normalize the data first. However, that is a topic for another post.
借助Pearson矩阵,我们可以轻松构建水果推荐系统。 例如,如果您输入您喜欢香蕉,它将推荐您使用“ maracuja”,因为这两者具有最高的相关性(0.67)。 您会惊讶于这种简单方法的强大功能。 我已经成功使用了多次。 如果要对频率数据帧执行类似的操作,则需要首先对数据进行规范化。 但是,这是另一篇文章的主题。
I hope this guide was useful to you and saved you some time or inspired you. Thank you all for reading!
希望本指南对您有所帮助,并节省您一些时间或启发您。 谢谢大家的阅读!
翻译自: https://towardsdatascience.com/dealing-with-list-values-in-pandas-dataframes-a177e534f173
熊猫数据集


 361
361

 被折叠的 条评论
为什么被折叠?
被折叠的 条评论
为什么被折叠?
 到【灌水乐园】发言


