


熊猫分发
Pandas is a very powerful and versatile Python data analysis library that expedites the data analysis and exploration process. The best way to learn the functions and methods offered by pandas is practicing.
Pandas是一个功能强大且用途广泛的Python数据分析库,可加快数据分析和探索过程。 学习熊猫提供的功能和方法的最好方法是练习。
Practice makes perfect.
实践使完美。
In this post, we will do lots of examples to explore various capabilities of pandas. We will do both simple and advanced examples to see what pandas is capable of.
在这篇文章中,我们将做很多例子来探索熊猫的各种功能。 我们将通过简单示例和高级示例来了解熊猫的功能。
As always, we start with importing numpy and pandas.
与往常一样,我们从导入numpy和pandas开始。
import pandas as pd
import numpy as np
Let’s first create a sample dataframe to work on. We can pass a dictionary to the DataFrame function of pandas.
让我们首先创建一个示例数据框以进行处理。 我们可以将字典传递给pandas的DataFrame函数。
df = pd.DataFrame({'num_1':np.random.random(100),
'num_2':np.random.random(100),
'num_3':np.random.randint(0,5,100),
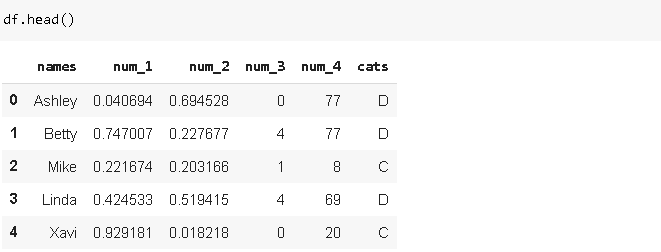
'num_4':np.random.randint(0,100,100)})df.head()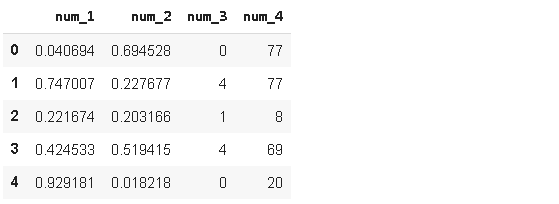
We’ve used numpy arrays to create numerical columns. Let’s also add categorical columns to our dataframe.
我们使用numpy数组创建数字列。 让我们还将分类列添加到我们的数据框中。
from random import samplename = ['Linda','John','Ashley','Xavi','Betty','Mike'] * 100
cat = ['A','B','C','D'] * 100names = sample(name, 100)
cats = sample(cat, 100)
The lists “names” and “cats” contain 100 randomly selected samples from the longer lists “name” and “cat”. We used sample function from random module of python.
列表“名称”和“猫”包含从较长列表“名称”和“猫”中随机选择的100个样本。 我们使用了来自python 随机模块的样本函数。
It is time add these two categorical features to the dataframe.
现在是时候将这两个分类功能添加到数据框中了。
df.insert(0, 'names', names)
df['cats'] = catsdf.head()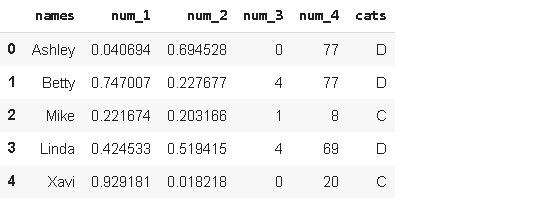
We added two new columns with two different ways. df[‘col’] = col adds the new column at the end. We can specify the location of new column using insert function as we did with “names” column.
我们以两种不同的方式添加了两个新列。 df ['col'] = col在末尾添加新列。 我们可以像使用“名称”列那样使用插入函数指定新列的位置。
Consider we are interested in the rows in which “num_1” is greater than “num_2”. The following two lines of codes accomplish this task and displays the first five rows.
考虑我们对“ num_1”大于“ num_2”的行感兴趣。 以下两行代码完成了此任务并显示了前五行。
df[df.num_1 > df.num_2][:5]df.query('num_1 > num_2')[:5]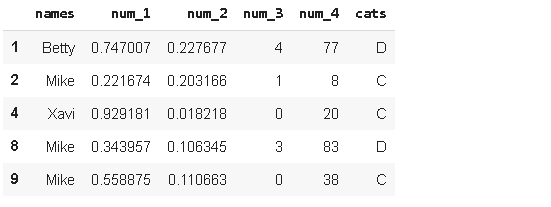
You can use either one but I prefer query function. I think it is simpler in case of more complex filters. If we want to see the comparison of “num_1” and “num_2” based on different categories(“cats”), we can apply groupby function on filtered dataframe.
您可以使用任何一个,但我更喜欢查询功能。 我认为在使用更复杂的过滤器的情况下更简单。 如果要查看基于不同类别(“猫”)的“ num_1”和“ num_2”的比较,可以对过滤的数据帧应用groupby函数。
df1 = df.query('num_1 > num_2') [['cats','names']].groupby('cats').count().reset_index()
df1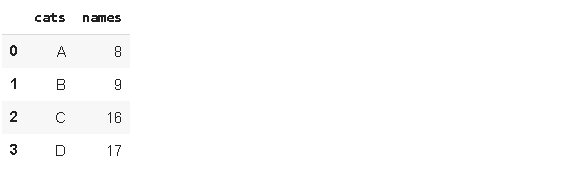
The column “names” is irrelevant here and just selected to be able to count rows. It seems like categories C and D have more rows in which “num_1” is higher than “num_2”. However, these numbers do not make sense unless we know how many rows each category has in the entire dataframe.
列“名称”在这里无关紧要,只是为了能够计算行而选择。 似乎类别C和D具有更多的行,其中“ num_1”高于“ num_2”。 但是,除非我们知道每个类别在整个数据框中具有多少行,否则这些数字没有意义。
ser = df['cats'].value_counts()df2 = pd.concat((df1,ser), axis=1)df2.rename(columns={'names':'num_1>num_2', 'cats':'total'}, inplace=True)df2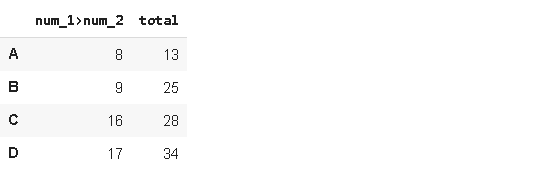
We have created a series that contains the count of each category in cats column using value_counts. Then we combined df1 and ser with concat function and renamed the columns. The final dataframe df2 shows the total number of rows for each category as well as the number of rows that fits the filtering argument.
我们使用value_counts创建了一个包含cats列中每个类别的计数的系列。 然后,我们将df1和ser与concat函数结合在一起,并重命名了列。 最终数据框df2显示每个类别的总行数以及适合过滤参数的行数。
Assume we want to see the average value in “num_4” for each category in “cats” but we want these values for only a few names. In this case, we can use isin method for filtering and then apply groupby.
假设我们希望看到“猫”中每个类别的平均值“ num_4”,但我们只希望这些名称只包含几个名称。 在这种情况下,我们可以使用isin方法进行过滤,然后应用groupby 。
name = ['Ashley','Betty','Mike']df[df.names.isin(name)][['cats','num_4']].groupby('cats').mean()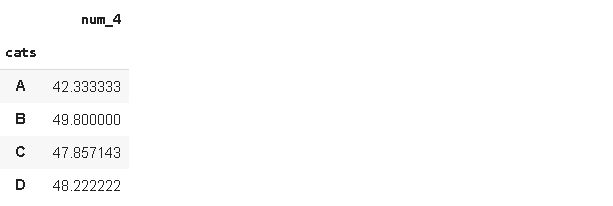
If the number of occurrences is also needed, we can apply multiple aggregate functions on groupby.
如果还需要出现次数,则可以在groupby上应用多个聚合函数。
name = ['Ashley','Betty','Mike']df[df.names.isin(name)][['cats','num_4']].groupby('cats').agg(['mean','count'])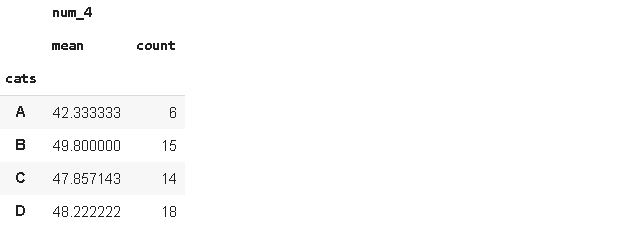
We have 4 different measurements stored in 4 different columns. We can combine them in one column and indicate the name of measurement in another column. Here is the original dataframe:
我们在4个不同的列中存储了4个不同的度量。 我们可以将它们合并在一个列中,并在另一列中指示测量名称。 这是原始数据框:
Melt function can be used to achieve what I just described.
融化功能可用于实现我刚刚描述的功能。
df_melted = df.melt(id_vars=['names','cats'])df_melted.head()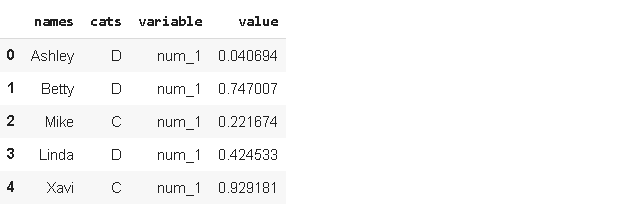
Melt is especially useful when working with wide dataframes (i.e. lots of features). For instance, if we had 100 different measurements (num_1 to num_100), it would be much easier to do analysis on a melted dataframe.
当使用宽数据框(即许多功能)时,融解特别有用。 例如,如果我们有100个不同的测量值(从num_1到num_100),则在融化的数据帧上进行分析会容易得多。
Our dataframe contains measurements so it is likely that we update the dataframe by adding new measurements. Let’s say we update the dataframe with the new_row below.
我们的数据框包含测量值,因此我们很可能会通过添加新的测量值来更新数据框。 假设我们使用下面的new_row更新数据框。
new_row = {'names':'Mike', 'num_1':0.678, 'num_2':0.345,
           'num_3':3, 'num_4':[68,80], 'cats':'C'}df_updated = df.append(new_row, ignore_index=True)
df_updated.tail()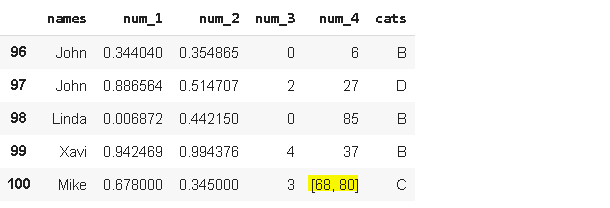
The new_row is added but there is a problem. It contains a couple of values for in “num_4” . We should have them in separate rows. The explode function of pandas can be used for this task.
添加了new_row,但是有问题。 它在“ num_4”中包含几个值。 我们应该将它们放在单独的行中。 熊猫的爆炸功能可用于此任务。
df_updated = df_updated.explode('num_4').reset_index(drop=True)
df_updated.tail()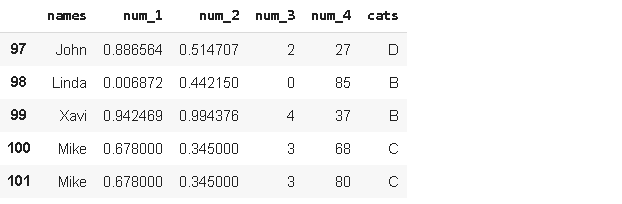
We have separated the values in “num_4”. There might be cases in which a column contains lots of combined values in many rows. Explode function may come handy in those cases.
我们将“ num_4”中的值分开。 在某些情况下,一列可能包含许多行中的许多组合值。 在这种情况下,爆炸功能可能会派上用场。
There might be cases in which we need to replace some values. Pandas replace function makes it very simple. We can even replace multiple values by passing a dictionary.
在某些情况下,我们需要替换一些值。 熊猫替换功能使其非常简单。 我们甚至可以通过传递字典来替换多个值。
replacement = {'D':'F', 'C':'T'}
df.cats.replace(replacement, inplace=True)df.head()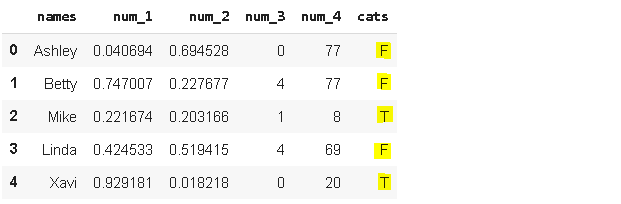
Let’s assume we need to replace some values based on a condition. The condition is specified as “the values below 0.5 in num_1 are to be replaced with 0”. We can use where function in this case.
假设我们需要根据条件替换一些值。 条件指定为“将num_1中的0.5以下的值替换为0”。 在这种情况下,我们可以使用where函数。
df['num_1'] = df['num_1'].where(df['num_1'] >= 0.5, 0)df.head()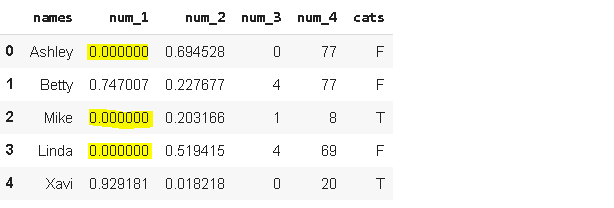
The way “where” works is that values that fit the condition are selected and the remaining values are replaced with the specified value. where(df[‘num_1’]≥0.5, 0) selects all the values in “num_1” that are greater than 0.5 and the remaining values are replaced with 0.
“ where”的工作方式是选择适合条件的值,然后将剩余的值替换为指定的值。 where(df ['num_1']≥0.5,0)选择“ num_1”中所有大于0.5的值,并将其余值替换为0。
The dataframe contains 4 numerical and 2 categorical features. We may need to see a quick summary on how numerical values change based on categories. Pandas pivot_table function can provide this kind of summary and it is very flexible in terms of display options.
数据框包含4个数字特征和2个分类特征。 我们可能需要查看有关数值如何根据类别变化的快速摘要。 熊猫的pivot_table函数可以提供这种摘要,并且在显示选项方面非常灵活。
df.pivot_table(index='names', columns='cats', values='num_2', aggfunc='mean', margins=True)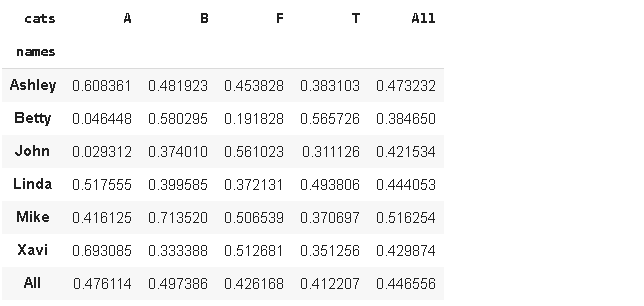
This table shows how num_2 values change according to names-cats combinations. It is better to set margin parameter as True to to see the comparison with the overall value. There are many options for aggfunc parameter such as count, min, max.
下表显示num_2值如何根据名称-猫的组合而变化。 最好将margin参数设置为True,以查看与总值的比较。 aggfunc参数有很多选项,例如count,min,max。
A highly common task with dataframes is to handle missing values. The dataframe we created does not have any missing values. Let’s first add some missing values randomly.
数据框最常见的任务是处理缺失值。 我们创建的数据框没有任何缺失值。 首先让我们随机添加一些缺失值。
a = np.random.randint(0,99,20)
df.iloc[a, 3] = np.nan
We created an array with 20 random integers between 0 and 99. Then we used it as index in iloc. 20 rows in the fourth column (column index is 3) are replaced with np.nan which is a missing value representation of pandas.
我们创建了一个数组,其中包含20个介于0到99之间的随机整数。然后将其用作iloc中的索引。 第四列中的20行(列索引为3)被替换为np.nan,这是熊猫的缺失值表示。
df.isna().sum() returns the number of missing values in each column.
df.isna()。sum()返回每列中缺失值的数量。
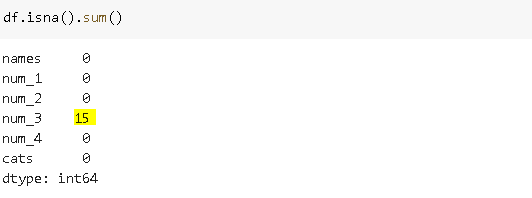
Although we passed in 20 indices, the number of missing values seems to be 15. It is because of the duplicate values in array a.
尽管我们传入了20个索引,但缺失值的数量似乎为15。这是因为数组a中的值重复。
len(np.unique(a))
15
We can replace the missing values with fillna function. We can use a constant to replace missing values or a statistic of the column such as mean or median.
我们可以用fillna函数替换缺少的值。 我们可以使用常量来替换缺失值或列的统计信息,例如平均值或中位数。
df['num_3'].fillna(df['num_3'].mean(), inplace=True)
df.isna().sum()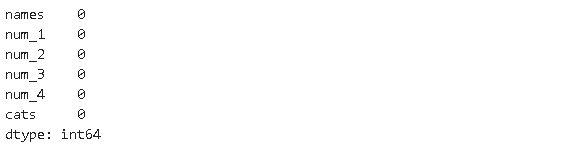
This is just a small piece of what you can do with Pandas. The more you work with it, the more useful and practical ways you find. I suggest approaching a problem using different ways and never place a limit in your mind.
这只是您对Pandas可以做的一小部分。 您使用它的次数越多,发现的方法就越有用和实用。 我建议您使用不同的方法来解决问题,切勿在您的脑海中置身事外。
When you are trying hard to find a solution for a problem, you will almost always learn more than the solution of the problem at hand. You will improve your skillset step-by-step to build a robust and efficient data analysis process.
当您努力寻找问题的解决方案时,您几乎总是会比手头的问题解决方案了解更多。 您将逐步提高技能,以建立可靠而有效的数据分析过程。
Thank you for reading. Please let me know if you have any feedback.
感谢您的阅读。 如果您有任何反馈意见,请告诉我。
翻译自: https://towardsdatascience.com/practical-pandas-guide-b3eedeb3e88
熊猫分发


 5878
5878

 被折叠的 条评论
为什么被折叠?
被折叠的 条评论
为什么被折叠?
 到【灌水乐园】发言


