


数据分析工具tableau
Remember those conversations between BI engineers when we randomly recommended reporting tools to each other? No? Just me? Okay!
还记得我们随机推荐彼此使用报告工具时BI工程师之间的对话吗? 没有? 只有我? 好的!
Nevertheless, whenever I have had those conversations, Tableau has been my number one choice of recommendation. This is simply based on the fact that Tableau has time and again proved itself to be the best friend of analysts and BI developers to visualize data in a simple (sorry Power BI users!), and flawless manner. Additionally, its impressive and experienced community is a huge helping hand, making the tool a very dependable one.
但是,无论何时进行这些对话,Tableau都是我推荐的第一选择。 这完全基于以下事实:Tableau一次又一次地证明自己是分析师和BI开发人员最好的朋友,他们以一种简单的方式(对不起Power BI用户!)并且完美无缺地可视化数据。 此外,其令人印象深刻且经验丰富的社区是一个巨大的帮手,使该工具非常可靠。
But, while Tableau is great to visualize data, can it collect data too? Hell, yeah!
但是,尽管Tableau可以很好地可视化数据,但它也可以收集数据吗? 地狱,是的!
Now, before we start, I would want to put a disclaimer that this implementation is not as comprehensive as having a web application. This will be limited to the features offered by Tableau and of course our imagination and skills for using those features. However, it would be much better compared to static data collection interfaces like MS Forms, considering it will be more dynamic and assistive. So, without any further delay let’s get going.
现在,在我们开始之前,我想声明一下,该实现不像具有Web应用程序那样全面。 这将仅限于Tableau提供的功能,当然还有我们使用这些功能的想象力和技巧。 但是,与静态数据收集接口(例如MS Forms)相比,它会更好,因为它会更加动态和辅助。 因此,我们不再拖延。
简要实施 (Implementation in Brief)
To get started, let’s just walk through the steps that we need to do for this implementation in brief. Further down the article, I will explain each of these steps in detail.
首先,让我们简单地完成此实现所需的步骤。 在本文的后续部分,我将详细解释每个步骤。
For this implementation, we will need to create 3 things:
对于此实现,我们将需要创建3件事:
A frontend interface: Our friend Tableau comes to the rescue. We can create a very nice data-driven interface on Tableau for our users to interact and then enter the data. To enter the data, the users would be provided a form on tableau itself
前端界面:我们的朋友Tableau来了。 我们可以在Tableau上创建一个非常漂亮的数据驱动界面,供我们的用户进行交互,然后输入数据。 要输入数据,将向用户提供有关tableau的表单
A microservice/web application accepting HTTP requests: The whole point of having this is to process and store the incoming data. We can create one for free using many programming languages or can get a managed service through AWS Lambda, O365 Power Apps services, or any other vendor. Here, we will be using Python with Flask because it’s easy and free. For my enterprise implementations, I use AWS Lambda and DynamoDB because the company is paying!
接受HTTP请求的微服务/ Web应用程序:这样做的全部目的是处理和存储传入的数据。 我们可以使用多种编程语言免费创建一个,也可以通过AWS Lambda,O365 Power Apps服务或任何其他供应商获得托管服务。 在这里,我们将在Flask中使用Python,因为它既简单又免费。 对于我的企业实施,我使用AWS Lambda和DynamoDB,因为该公司正在付款!
A data storing platform: This is the place where we will be storing the data. For enterprise solutions that have to be highly available, I would recommend using an enterprise database service like MS SQL Server, Oracle, or for my No-SQL aficionados — DynamoDB by AWS. Here, we will use the free and awesome SQLite
数据存储平台:这是我们将存储数据的地方。 对于必须高度可用的企业解决方案,我建议使用诸如MS SQL Server,Oracle之类的企业数据库服务,或者对于我的No-SQL爱好者-AWS的DynamoDB使用。 在这里,我们将使用免费且出色SQLite
用例简介 (Brief Introduction of the Use-Case)
We will be building a simple Candidate Interview Score Gathering System where the interviewers and recruiters enter scores for a particular candidate through our tableau interface and the numbers are stored in a database
我们将构建一个简单的候选人面试分数收集系统 ,在该系统中,面试官和招聘人员通过我们的Tableau界面输入特定候选人的分数,并将数字存储在数据库中
让我们谈谈细节 (Let’s talk details)
Before I begin…
在我开始之前...
The explanation below is going to make much more sense to the audience if they have a working knowledge of Python and Tableau. I would try to provide relevant links to topics wherever possible
如果听众具有Python和Tableau的使用知识,那么下面的解释对他们来说会更有意义。 我会尽可能提供与主题相关的链接
We will start with the design of the backend first
我们将首先从后端的设计开始
Web应用程序 (Web Application)
For this implementation, I will be using Flask as I mentioned before. Flask is a very nice micro framework to create high performance and nifty web applications. Now, back to our implementation, please refer to the code below for our flask application
对于此实现,我将使用前面提到的Flask。 Flask是一个非常好的微框架,用于创建高性能和漂亮的Web应用程序。 现在,回到我们的实现中,请参考下面的烧瓶应用程序代码
The above code creates a very simple service using FLASK which accepts GET requests and inserts the data into an SQLite database by creating a pandas dataframe.
上面的代码使用FLASK创建了一个非常简单的服务,该服务接受GET请求,并通过创建pandas数据框将数据插入SQLite数据库。
Here GET method is used instead of the standard POST method because Tableau is capable of sending only GET requests.
这里,使用GET方法代替标准的POST方法,因为Tableau仅能够发送GET请求。
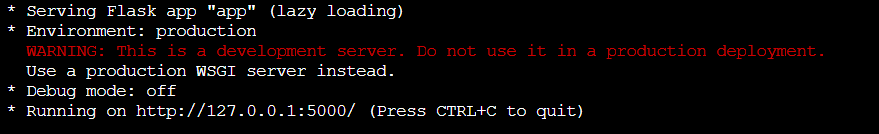
Waitress is a production-ready server for Flask that would run our web application. But, since we will be running the implementation locally, we will be using the best server of all time — localhost
Waitress是Flask的生产就绪服务器,它将运行我们的Web应用程序。 但是,由于我们将在本地运行实现,因此我们将使用有史以来最好的服务器-本地主机
Here is what it looks like when we run the above code:
这是运行上面的代码时的样子:
The URL to be used for sending the data is:
用于发送数据的URL是:
HTTP://127.0.0.1:5000/submitscore/<name>/<category>/<score>/<submitter>
HTTP://127.0.0.1:5000/submitscore/ <名称> / <类别> / <得分> / <submitter>
Here the data to be inserted is represented as URL parameters like <this>
这里要插入的数据表示为URL参数,例如<this>
资料储存平台 (Data Storing Platform)
As we could see from the above code snippet, we will be inserting our data into an SQLite database. The data table to be used is hiringscoredata. Before we dive into Tableau implementation, let’s see what happens when we try to insert some data using a GET request
从上面的代码片段可以看出,我们将数据插入到SQLite数据库中。 要使用的数据表是hiringscoredata。 在深入研究Tableau实施之前,让我们看看尝试使用GET请求插入一些数据时发生的情况
- We will be using Chrome to send the request as we know our browsers are capable of sending GET requests 我们将使用Chrome发送请求,因为我们知道我们的浏览器能够发送GET请求
- So, let’s give a candidate named Prashasti Mehta, a score of 8 out of 10 for her communication skills. The score is submitted by yours truly 因此,让我们给一个名为Prashasti Mehta的候选人提供10分,满分为10分的交流技巧。 分数是您真实提交的
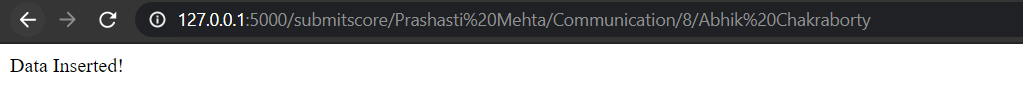
For the above, our URL now would be: http://127.0.0.1:5000/submitscore/Prashasti%20Mehta/Communication/8/Abhik%20Chakraborty
对于上述内容,我们的URL现在将为: http : //127.0.0.1 : 5000/submitscore/Prashasti%20Mehta/Communication/8/Abhik%20Chakraborty
- This is what happened after we triggered the above URL on chrome. The below screen grabs are from Chrome and SQLite respectively 这是我们在chrome上触发上述网址后发生的情况。 下面的屏幕截图分别来自Chrome和SQLite

Tableau界面 (Tableau Interface)
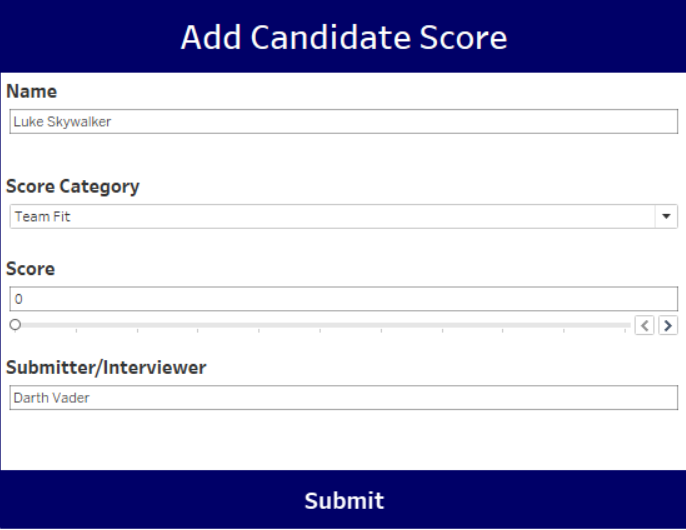
I know this is what we have been waiting for. Now, we will create an interface on Tableau to insert the data. This implementation can be expanded with multiple features and complexities. For this article, I designed a very simple interface as shown below
我知道这就是我们一直在等待的东西。 现在,我们将在Tableau上创建一个接口以插入数据。 可以通过多种功能和复杂性来扩展此实现。 对于本文,我设计了一个非常简单的界面,如下所示
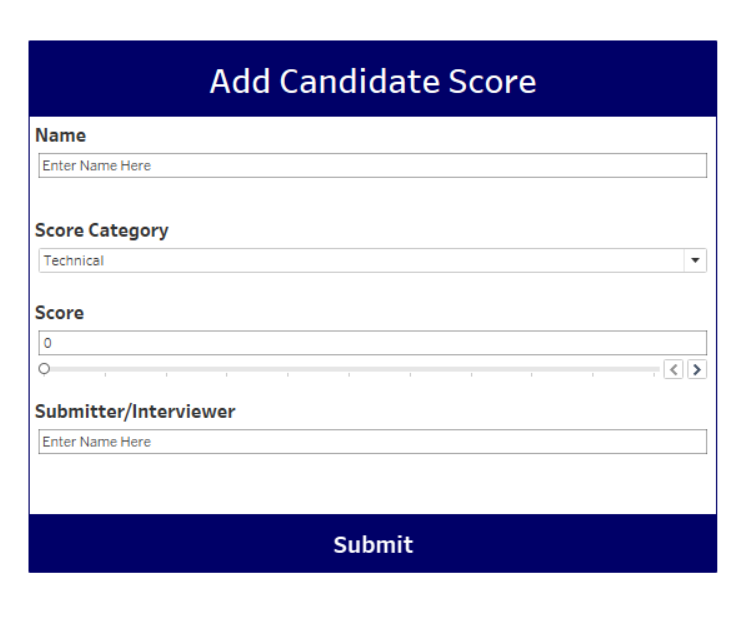
Here, all the fields are tableau parameters. However, we can use dropdowns generated from any data source too.
在这里,所有字段都是tableau参数 。 但是,我们也可以使用从任何数据源生成的下拉列表。
Next, we need to submit the data entered here to our server. To do this, we create a tableau calculated field to concatenate the data generated from the above parameters into the standard URL format accepted by our web application.
接下来,我们需要将此处输入的数据提交给我们的服务器。 为此,我们创建一个表格计算字段,以将上述参数生成的数据连接到Web应用程序接受的标准URL格式中。
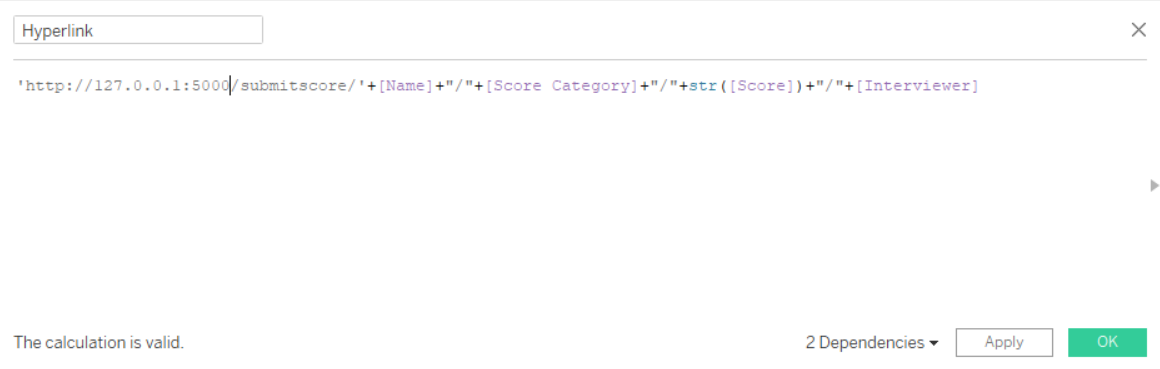
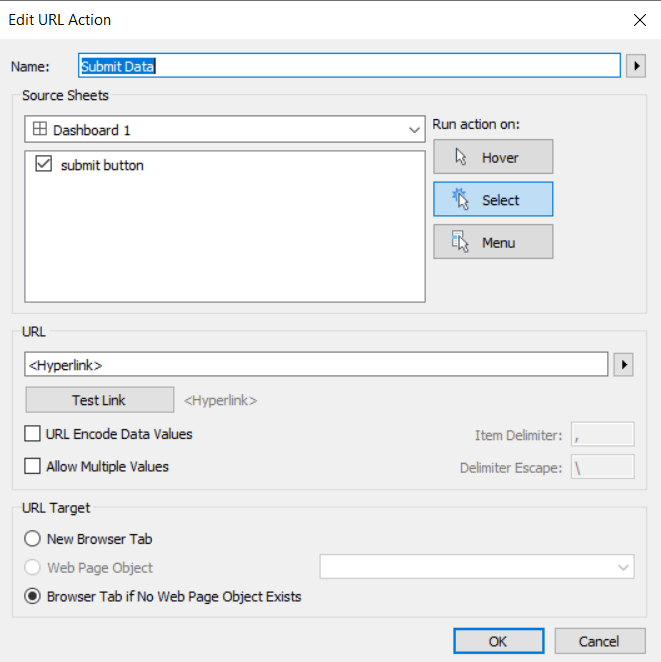
Finally, we add a URL Action that would hit the URL we created under the “Hyperlink” calculated field above. The action is applied to the SUBMIT button on the form which is essentially a worksheet named with a very intuitive name — ‘submit button’
最后,我们添加一个URL操作 ,该操作将击中我们在上面的“超级链接”计算字段下创建的URL。 该操作将应用于表单上的“提交”按钮,该按钮本质上是一个以非常直观的名称命名的工作表-“提交按钮”
And we are done!
我们完成了!
让我们测试! (Let’s test!)
So, the moment is here. Let’s insert some data from our tableau form.
所以,现在到了。 让我们从表格表单中插入一些数据。
- We enter the details as below 我们输入如下详细信息
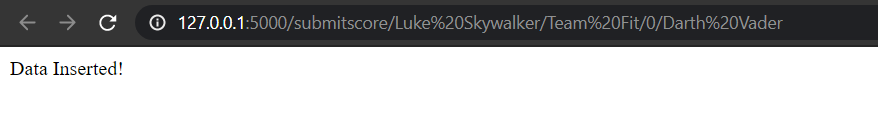
- Next, after pressing submit, this is what we get on the browser 接下来,在点击提交之后,这就是我们在浏览器上看到的
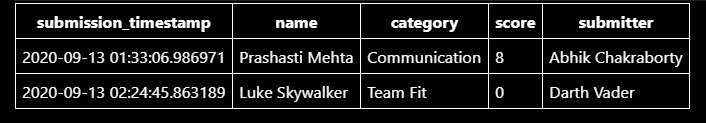
- Finally, after the data is inserted, the data table looks like below 最后,插入数据后,数据表如下所示
- Yeah, it’s okay to dance! You did it! 是的,可以跳舞! 你做到了!
免责声明 (Disclaimer)
While the above is a handy implementation to create a data capturing application right inside the BI dashboard, I want to highlight that this implementation should not be used for sensitive information like username, passwords, financial information, etc. For that, we have awesome software developers creating secure applications and gateways
尽管以上是在BI仪表板内部创建数据捕获应用程序的便捷实现,但我想强调指出,该实现不应用于用户名,密码,财务信息等敏感信息。为此,我们拥有出色的软件开发人员创建安全的应用程序和网关
While the above implementation is limited to a local system, it can be easily expanded by hosting the web application on a virtual machine or by using Docker. Additionally, we can also publish the dashboard on to a Tableau Server for the audience. We can also implement the webserver backend using serverless services like AWS Lambda. If you are not so sure about coding, another great way of doing it is using Microsoft PowerAutomate. It provides a lot of great functionalities and features in a drag and drop format. Additionally, a lot of its features are available for free or through your O365 subscription.
尽管以上实现仅限于本地系统,但可以通过在虚拟机上托管Web应用程序或使用Docker轻松扩展它。 此外,我们还可以将仪表板发布到供观众使用的Tableau Server上。 我们还可以使用无服务器服务(例如AWS Lambda)来实现Web服务器后端。 如果您不确定编码,那么另一种很棒的方法是使用Microsoft PowerAutomate 。 它以拖放格式提供了许多出色的功能和特性。 此外,它的许多功能是免费提供的,也可以通过O365订阅获得。
I hope this small tutorial will get you started towards using Tableau as a data capturing tool. If you need me to do a more production-ready implementation of this, drop me your views in the comment section.
我希望这个小教程可以帮助您开始使用Tableau作为数据捕获工具。 如果您需要我对此进行更多生产准备的实现,请在评论部分中发表您的看法。
Cheers!
干杯!
翻译自: https://medium.com/swlh/create-a-data-capturing-tool-with-tableau-93287df06f2a
数据分析工具tableau


 1308
1308

 被折叠的 条评论
为什么被折叠?
被折叠的 条评论
为什么被折叠?
 到【灌水乐园】发言


