


master x轴转换z轴
Full notebook at https://gist.github.com/gitgithan/0ba595e3ef9cf8fab7deeb7b8b533ba3Alternatively, click “view raw” at the bottom right of this scrollable frame and save the json as an .ipynb file
完整笔记本位于https://gist.github.com/gitgithan/0ba595e3ef9cf8fab7deeb7b8b533ba3或者,单击此可滚动框架右下角的“查看原始文件”,并将json保存为.ipynb文件。
In this article i will explore how dataframe.stack(), dataframe.melt(), dataframe.pivot_table from pandas data manipulation library of python interact with each other in a transformation pipeline to reshape dataframes and recover the original dataframe, along with numerous caveats along the way by following along the code.
在本文中,我将探讨python熊猫数据处理库中的dataframe.stack(),dataframe.melt(),dataframe.pivot_table如何在转换管道中相互交互以重塑数据帧并恢复原始数据帧,以及许多注意事项遵循代码。
 from IPython.core.interactiveshell import InteractiveShell
InteractiveShell.ast_node_interactivity = “all” import pandas as pd
By default, jupyter notebooks only display the last line of every cell. The first two lines make jupyter display the outputs of all variables as a convenience to avoid wrapping print() around every single variable I wish to see. Next, we import the pandas library where we call the dataframe reshaping functions from.
默认情况下,jupyter笔记本仅显示每个单元格的最后一行。 前两行使jupyter显示所有变量的输出,以方便避免将print()包裹在我希望看到的每个变量周围。 接下来,导入pandas库,从中调用数据框重塑函数。
方法1:df→堆栈→重置索引→轴点→df (Method 1: df →stack →reset_index →pivot →df)
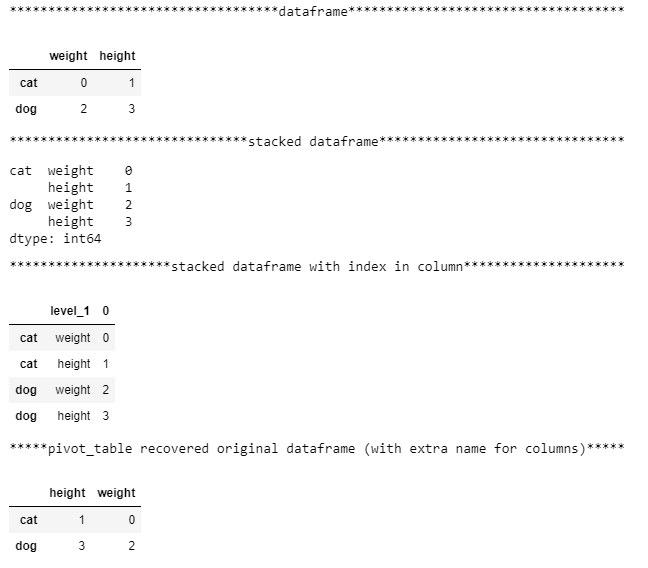
 df= pd.DataFrame([[0, 1], [2, 3]],index=['cat', 'dog'],columns=['weight', 'height']) print('{:*^80}'.format('dataframe'))
df print('{:*^80}'.format('stacked dataframe'))
df.stack()
Here, we create the dataframe. Then df.stack() turns our single-level column df into a dataseries with a multi-index index by fitting the columns into a new inner index (index level 1) for each value in the old outer index (index level 0). The outer level looks like it has only 2 values [cat,dog], but it is only for neat display and is really 4 values [cat,cat,dog,dog]. Something useful to note from: https://pandas.pydata.org/pandas-docs/stable/generated/pandas.DataFrame.stack.htmlif the columns have multiple levels, the new index level(s) is (are) taken from the prescribed level(s) and the output is a DataFrame. So it’s good to keep in mind whether the transformation output is a dataseries or dataframe.
在这里,我们创建数据框。 然后df.stack()通过将旧的外部索引(索引级别0)中的每个值拟合到新的内部索引(索引级别1)中,将单级列df转换为具有多索引索引的数据系列。 外层看起来只有2个值[cat,dog],但仅用于整洁的显示,实际上是4个值[cat,cat,dog,dog]。 请注意以下有用的内容: https : //pandas.pydata.org/pandas-docs/stable/generation/pandas.DataFrame.stack.html 如果列具有多个级别,则采用新的索引级别从规定的级别开始,输出是一个DataFrame。 因此,最好记住转换输出是数据系列还是数据帧。
 print('{:*^80}'.format('stacked dataframe with index in column'))
df.stack().reset_index(level = 1)   #AttributeError: 'Series' object has no attribute 'pivot_table' , so must convert to dataframe before pivot_table
stacked = df.stack().reset_index(level = 1)
The values are aligned accordingly to the indexes, turning the dataframe from a wide format to a long format dataseries. Because pivot_table is a dataframe method and does not apply to dataseries, we can extract level 1 of the multi-index using reset_index(level = 1) to prepare for pivoting back. Specifying level = 0 would have extracted the outer index into a column. Note that ‘level_1’ is automatically added as a column name after reset_index(). This will be extra information that can be used or cleaned and ignored later. The 0 column above values is added automatically too.
这些值将根据索引进行对齐,从而将数据帧从宽格式转换为长格式数据系列。 由于pivot_table是数据框方法,并且不适用于数据系列,因此我们可以使用reset_index(level = 1)提取多索引的级别1,以准备向后旋转。 指定level = 0会将外部索引提取到列中。 请注意,“ level_1”将作为reset_index()之后的列名称自动添加。 这将是多余的信息,可以在以后使用或清除并忽略。 值上方的0列也会自动添加。
It does not matter if you extracted level 0 or level 1 at this stage. You can simply switch the inputs to index and columns parameters of pivot_table later to achieve the same output (barring the tiny df.columns.name difference) and recover the original dataframe.
在此阶段提取级别0还是级别1都没有关系。 您稍后可以简单地将输入切换到ivot_table的索引和列参数,以实现相同的输出(除非有微小的df.columns.name差异)并恢复原始数据帧。
 print('{:*^80}'.format('pivot_table recovered original dataframe (with extra name for columns)'))
recovered_df1 = df.stack().reset_index(level = 1).pivot_table(index = stacked.index, columns = 'level_1',values = 0) #pivot_table orders columns alphabetically,specifying values parameter prevents creation of useless multiindex column
recovered_df1.columns.name = None  #remove 'level_1' column.name
recovered_df1
Finally, we specify index and columns parameters in pivot_table by selecting from the current column names to describe how the final pivoted dataframe should look like. The values parameter is optional, but not specifying it will add column names not yet specified in index or columns parameters to the outerlevel of current columns to create multi-indexed columns that look ugly and make data access unnecessarily difficult.
最后,通过从当前列名称中进行选择来指定数据透视表的索引和列参数,以描述最终数据透视表的外观。 values参数是可选的,但未指定它将在索引或column参数中尚未指定的列名添加到当前列的外部级别,以创建看起来很丑陋的多索引列,从而使数据访问变得不必要地困难。
方法2:df→堆栈→转换为数据框→轴→df (Method 2: df →stack →convert to dataframe →pivot →df)
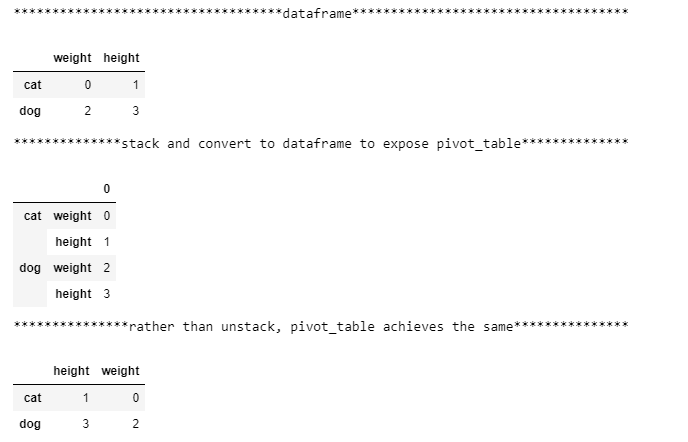
 print('{:*^80}'.format('dataframe'))
df
print('{:*^80}'.format('stack and convert to dataframe to expose pivot_table'))
stacked_df = pd.DataFrame(df.stack())
stacked_df
Remember that pivot_table is a dataframe method and does not apply to dataseries, so rather than reset_index as in part1, we can directly construct a dataframe from the series using pd.DataFrame(df.stack()) to create a multi-indexed dataframe to make the pivot_table method available and work harder in specifying its parameters correctly.
请记住,pivot_table是一个数据框方法,不适用于数据序列,因此,与其像part1中的reset_index一样,我们还可以使用pd.DataFrame(df.stack())从该序列直接构造一个数据框,以创建一个多索引数据框使pivot_table方法可用,并更加努力地正确指定其参数。
 print('{:*^80}'.format('rather than unstack, pivot_table achieves the same'))
idx_lvl0, idx_lvl1 = stacked_df.index.get_level_values(0), stacked_df.index.get_level_values(1)
recovered_df2 = stacked_df.pivot_table(index=idx_lvl0,columns = idx_lvl1,values = 0)
recovered_df2
index.get_level_values(0) is a way to get the index values of the specified muti-index level (in this case, 0) as a pandas.core.indexes.base.Index object which can be conveniently used by functions accepting sequences/lists. In part 2, we match the correct index information from each level into the index and columns parameters of pivot table to recover the original dataframe. Part 2 is cleaner than part 1 because there was no reset_index to create an extra ‘level_0’ or ‘level_1’ in df.columns.name that we set to None in part 1.
index.get_level_values(0)是一种获取指定多索引级别索引的值(在这种情况下为0)的方法,作为pandas.core.indexes.base.Index对象,接受序列/列表。 在第2部分中,我们将来自每个级别的正确索引信息与数据透视表的index和column参数进行匹配,以恢复原始数据帧。 第2部分比第1部分干净,因为没有reset_index在df.columns.name中创建额外的“ level_0”或“ level_1”,而在第1部分中将其设置为“无”。
方法3:df→熔融→添加索引→轴点→df (Method 3: df →melt →add index →pivot →df)

 print('{:*^80}'.format('dataframe'))
df
print('{:*^80}'.format('melting loses index information'))
melted = df.melt()   #melt appends columns into new "variable" column, while stack adds columns to new inner index layer (same information end up different places)
melted
Similar to stacking, melt turns wide format data to long format data by putting compressing columns into a single list. The difference is that stack inserted this list into the inner index, while melt inserts this list as a new column called ‘variable’ (can be renamed).
与堆叠类似,melt通过将压缩列放入单个列表中,将宽格式数据转换为长格式数据。 区别在于堆栈将此列表插入到内部索引中,而melt将此列表作为名为“变量”(可以重命名)的新列插入。
 print('{:*^80}'.format('manually enrich index')) # until this is solved: https://github.com/pandas-dev/pandas/issues/17440
melted.index = ['cat','dog']*2   #list(df.index)*len(df.columns) for more generalizable index generation
melted
Note that melt has made the cat dog information in the index disappear. This makes it impossible to recover the original dataframe. Until this issue (https://github.com/pandas-dev/pandas/issues/17440) is fixed, we have to manually add back the index.
注意融化使索引中的猫狗信息消失了。 这使得不可能恢复原始数据帧。 在修复此问题( https://github.com/pandas-dev/pandas/issues/17440 )之前,我们必须手动添加索引。
 print('{:*^80}'.format('pivot_table recovered original dataframe (with extra name for columns)'))
recovered_df3 = melted.pivot_table(index = melted.index, columns = 'variable',values = 'value')
recovered_df3.columns.name=None  #remove 'variable' column.name
recovered_df3
Finally, pivot_table with the right parameters will recover our original dataframe. Like in part 1, ‘variable’ is removed from df.columns.name for exact recovery.
最后,带有正确参数的数据透视表将恢复我们的原始数据帧。 像第1部分中一样,从df.columns.name中删除了“变量”以进行精确恢复。
结论 (Conclusion)
I hope these transformations have given beginners to these functions a better understanding of how flexible pandas is. The same information can be placed in Index or Columns using set_index and reset_index depending on where they serve the greatest purpose. For example, instead of df.loc[df.col == value] to filter when the information is in a column, setting col to the index, and doing df.loc[value] is much simpler. Whether information is in the index or column will also greatly affect how pd.merge, pd.concat, dataframe.join work on such dataseries/dataframes, but that would be another whole article by itself.
我希望这些转变使这些功能的初学者能够更好地了解熊猫的柔韧性。 可以使用set_index和reset_index将相同的信息放置在“索引”或“列”中,具体取决于它们发挥最大作用的位置。 例如,当信息在列中时,不是使用df.loc [df.col == value]进行过滤,而是将col设置为索引,然后执行df.loc [value]更简单。 信息是在索引中还是在列中也将极大地影响pd.merge,pd.concat,dataframe.join在此类数据系列/数据帧上的工作方式,但这本身就是另一篇文章。
Stack allows information from columns to swing to indexes and vice versa (with unstack()). Melt combines columns to a standard 3-column format of id_vars, variable, value to allow columnar processing of variable before pivoting back with edited column values. Pivot_table is the most powerful among the 3 with other parameters such as aggfunc (aggregation) that allows custom functions so possibilities there are limitless. Finally, here is a practical example that helped me a lot: http://pbpython.com/pandas-pivot-table-explained.html
堆栈允许信息从列摆动到索引,反之亦然(使用unstack())。 Melt将列合并为id_vars,变量,值的标准3列格式,以允许对变量进行列式处理,然后再使用编辑的列值进行回滚。 Pivot_table是3种功能中最强大的,它带有其他参数,例如aggfunc(聚合),该参数允许自定义函数,因此存在无限的可能性。 最后,这是一个实用的示例,对我有很大帮助: http : //pbpython.com/pandas-pivot-table-explained.html
翻译自: https://towardsdatascience.com/transformations-of-stack-melt-pivot-table-901292196d9e
master x轴转换z轴


 1万+
1万+

 被折叠的 条评论
为什么被折叠?
被折叠的 条评论
为什么被折叠?
 到【灌水乐园】发言


