


vs显示堆栈数据分析
A poor craftsman blames his tools. But if all you have is a hammer, everything looks like a nail.
一个可怜的工匠责怪他的工具。 但是,如果您只有一把锤子,那么一切看起来都像钉子。
It’s common for web developers or database adminstrators to refer to their “stack” of tools used to do the job, but I’ve never heard this moniker used for data analysts. So it got me thinking, what is the data analytics stack?
Web开发人员或数据库管理员通常会引用他们的“堆栈”工具来完成这项工作,但是我从未听说过这个用于数据分析师的绰号。 因此,我想到了什么是数据分析堆栈?
Data analysts make range of a wide variety of software, for a wide variety of tasks. When a solution comes up short, the focus ought not to be on “blaming” tools for their shortcomings, but on possessing alternatives and choosing a better one (or ones) for the given scenario.
数据分析人员可以使用各种各样的软件来完成各种各样的任务。 当解决方案出现问题时,重点不应放在针对其缺点的“责备”工具上,而在于针对给定方案拥有替代方案并选择更好的方案。
That is, it’s better to think of these tools as “slices” of the same stack to be used concurrently, rather than as misfits to be entirely discarded.
也就是说,最好将这些工具视为要同时使用的同一堆栈的“切片”,而不是被完全丢弃的不匹配项。
To imagine what the analytics stack might look like, I used the below data products Venn diagram, placing the logos of popular data analytics tools in their respective segments.
为了想象分析堆栈的外观,我使用了以下数据产品维恩图 ,将流行的数据分析工具的徽标放在各自的细分中。
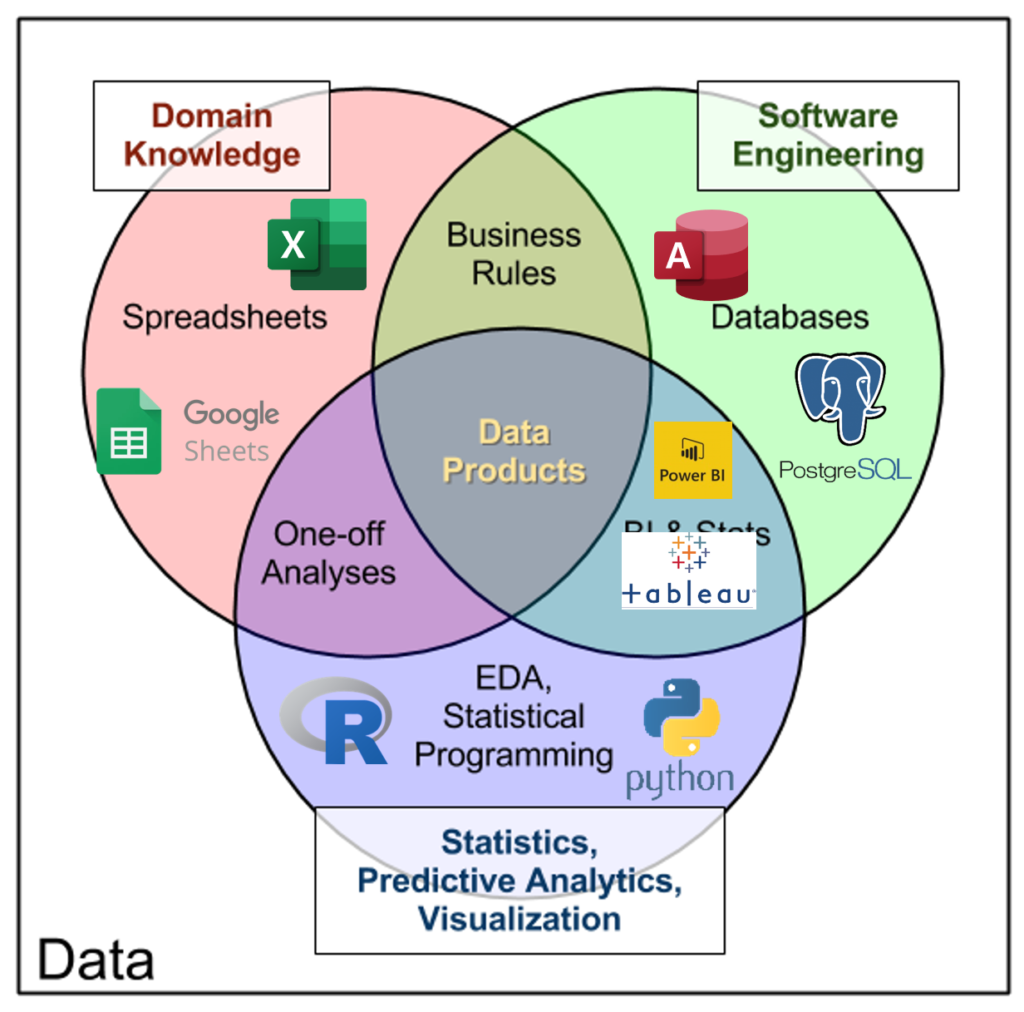
After stepping back from my marked-up Venn diagram, four categories or “slices” of the stack appeared to me. Let’s get to them below; but first, a caveat.
从我标记的维恩图退后,我看到了堆栈的四个类别或“切片”。 让我们在下面找到它们; 但首先要注意。
保持供应商不可知 (Staying vendor agnostic)
Some vendors have packaged their own “stack” of tools for data analysis; for example, Microsoft’s Power Platform or Google Data Studio. I am keeping my overview of the stack vendor-agnostic.
一些供应商已经打包了自己的“堆栈”工具来进行数据分析。 例如Microsoft的Power Platform或Google Data Studio。 我保持对堆栈供应商不可知的概述。
While you may learn that some slices fit better together, it’s better to start with the context of what category to tool to use, when, rather than what vendor. I will, however, provide a brief industry landscape of these products below, and suggestions for future learning.
虽然您可能会发现某些部分可以更好地结合在一起,但最好从使用哪种工具,何时使用的类别而不是什么供应商的上下文开始。 但是,我将在下面提供这些产品的简要行业概况,并为以后的学习提供建议。
试算表 (Spreadsheets)
Reports of the death of spreadsheets are greatly exaggerated. For their ease of use and flexibility, spreadsheets are an excellent choice for back-of-the-envelope calculations and prototyping.
电子表格死亡的报告被大大夸大了。 由于其易用性和灵活性,电子表格是进行封底计算和原型制作的绝佳选择。
However, spreadsheets do have their limitations. They can lack data integrity, storage and delivery functionalities. These limitations are often what cause pundits to give spreadsheets their last rites. But this misses the point of “the stack” entirely — those tasks aren’t the proper context for spreadsheets in the first place.
但是,电子表格确实有其局限性。 它们可能缺乏数据完整性,存储和交付功能。 这些局限性通常是导致专家给电子表格提供最新服务的原因。 但这完全错过了“堆栈”的要点-这些任务最初并不是电子表格的适当上下文。
The major spreadsheet applications are Microsoft Excel and Google Sheets. I won’t tell you outright my preference, but you may find out if you follow me on social media for long.
主要的电子表格应用程序是Microsoft Excel和Google表格。 我不会直接告诉您我的偏好,但是您可能会发现您是否在社交媒体上长期关注我。
资料库 (Databases)
Databases are a relatively ancient technology in the analytics space, but show no signs of slowing. They offer more reliable and extensible methods for data storage and integrity, but the actual analysis easily done directly inside databases is limited.
数据库是分析领域中相对较旧的技术,但没有丝毫放缓的迹象。 它们为数据存储和完整性提供了更可靠和可扩展的方法,但是直接在数据库内部轻松进行的实际分析受到限制。
Structured query language, or SQL, is the language used to interact with relational database management systems. While many SQL platforms exist, the types of read-only operations necessary for most data analysts won’t change across them.
结构化查询语言或SQL,是用于与关系数据库管理系统进行交互的语言。 尽管存在许多SQL平台,但大多数数据分析师所需的只读操作类型不会在它们之间发生变化。
For data analysts new to SQL, I suggest SQLite or Microsoft Access as lightweight tools for learning SQL.
对于不熟悉SQL的数据分析师,我建议使用SQLite或Microsoft Access作为学习SQL的轻量级工具。
商业智能和仪表板平台 (Business intelligence & dashboard platforms)
This is a broad swathe of tools and it’s likely the most ambiguous slice of the stack, but here I mean enterprise tools that allow users to gather, model and display data.
这是各种各样的工具,可能是堆栈中最模糊的部分,但是这里我指的是允许用户收集,建模和显示数据的企业工具。
Data warehousing tools like MicroStrategy and SAP BusinessObjects straddle the line here, since they are tools designed for self-service data gathering and analysis. But these often have limited visualization and iteractive report-building included.
诸如MicroStrategy和SAP BusinessObjects之类的数据仓库工具是这里的佼佼者,因为它们是设计用于自助数据收集和分析的工具。 但是,这些方法通常在可视化和有限的报表生成方面受到限制。
That’s where tools like Power BI, Tableau and Looker come in. These tools allow users to build data models, dashboards and reports with minimal coding. Importantly, they make it easy to disseminate and update information across an organization.
这就是诸如Power BI,Tableau和Looker之类的工具出现的地方。这些工具允许用户以最少的代码构建数据模型,仪表板和报告。 重要的是,它们使在整个组织中传播和更新信息变得容易。
However, these tools tend to be inflexible in the way they handle and visualize data. They can also be expensive, with single-user annual licenses running several hundred or even thousands of dollars.
但是,这些工具在处理和可视化数据方面往往缺乏灵活性。 它们也可能很昂贵,单用户年度许可证要花费数百甚至数千美元。
数据编程语言 (Data programming languages)
While many vendor tools are moving to a place where coding is not as essential to the data workflow, I still think it’s a good idea to learn programming. This helps sharpen understanding of how data processing works, and gives users fuller control of their workflow over using a graphical user interface (GUI).
尽管许多供应商工具正在迁移到编码对数据工作流不那么重要的地方,但我仍然认为学习编程是一个好主意。 这有助于加深对数据处理方式的理解,并通过图形用户界面(GUI)使用户对他们的工作流程有更全面的控制。
For data analytics, two open-source programming language are good fits: R and Python. Each include a dizzying universe of free packages made to help with everything from social media automation to geospatial analysis. Learning these tools also opens the door to advanced analytics and data science.
对于数据分析,两种开源编程语言非常适合:R和Python。 每个软件包都包含令人眼花of乱的免费软件包,可帮助您处理从社交媒体自动化到地理空间分析的所有问题。 学习这些工具还为高级分析和数据科学打开了一扇门。
However, this slice could have the steepest learning curve in the stack, and many analysts may struggle to see the benefit of learning to code, when they can do most of what they need easily enough from a GUI.
但是,这部分可能是堆栈中最陡峭的学习曲线,并且当他们可以从GUI轻松地完成大部分所需工作时,许多分析师可能很难看到学习编码的好处。
不分好坏,只是有所不同 (Not better or worse, just different)
Seen in the light of a “stack,” it makes little sense to compare any of these slices, or claim one as inferior than the other. They are meant to be complementary.
从“堆栈”的角度来看,比较这些切片中的任何切片,或声称其中一个切片的质量低于另一个切片,都没有什么意义。 它们是互补的。
Data analysts often wonder which tool they should focus on learning or becoming the expert in. I would suggest not becoming the expert in any single one, but in learning each slice of the stack well enough to contextualize and choose between them.
数据分析人员经常想知道应该专注于学习或成为专家的工具。我建议不要成为任何一个专家,而是要充分学习堆栈的每个部分以进行上下文关联并在它们之间进行选择。
进入堆栈 (Entering the stack)
Learning one data tool is daunting. Learning a whole “stack” of them can seem impossible. However, this cross-training can expedite growth, as connections are made across platforms in how to use data effectively.
学习一种数据工具令人生畏。 学习整个“堆栈”似乎是不可能的。 但是,由于跨平台建立了如何有效使用数据的联系,因此这种交叉训练可以加快增长。
What data tools do you use? How do you fit together? Other thoughts on the idea of an “analytics stack?” Let’s discuss in the comments.
您使用什么数据工具? 你们如何在一起? 关于“分析堆栈”的其他想法? 让我们在评论中进行讨论。
Originally published at https://georgejmount.com on August 8, 2020.
最初于 2020年8月8日 发布在 https://georgejmount.com 上。
翻译自: https://medium.com/@georgemount/what-is-the-data-analytics-stack-7c87e4d4c2e
vs显示堆栈数据分析


 324
324

 被折叠的 条评论
为什么被折叠?
被折叠的 条评论
为什么被折叠?
 到【灌水乐园】发言


