


 数据可视化是机器学习中不可或缺的环节,它帮助我们理解复杂数据集。文章介绍了Python中的三大可视化库:Matplotlib、Seaborn和Plotly,强调了可视化的重要性并展示了如何利用它们揭示数据模式。
Data visualization is an important skill to possess for anyone trying to extract and communicate insights from data. In the field of machine learning, visualization plays a key role throughout the entire process of analysis.
对于任何试图从数据中提取和传达见解的人来说,数据可视化都是一项重要技能。 在机器学习领域,可视化在整个分析过程中都扮演着关键角色。
Why do we need to visualize the data?
为什么我们需要可视化数据?
Let’s say, we have data set of Car Sales across four continents in the first 11 months.
假设我们在前11个月拥有四大洲的汽车销售数据集。
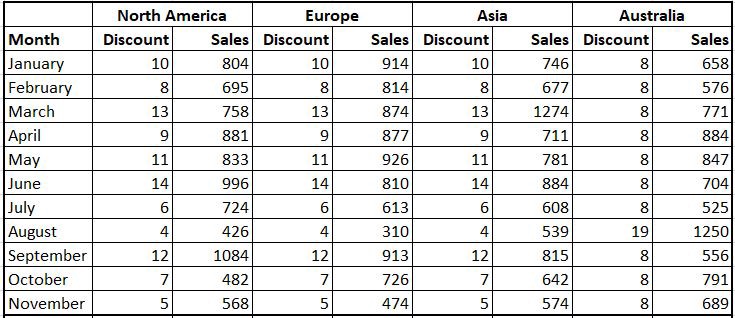
It is pretty cumbersome to analyze each column separately and draw some conclusions by the above data. So, what we generally do is, summarize the data and deduce some insights from it. Now, let’s see how the sales have performed in each continent when compared to others, for that, we’ll calculate the average of Discount and Sales for each continent,
分别分析各列并根据上述数据得出一些结论是非常麻烦的。 因此,我们通常要做的是汇总数据并从中得出一些见解。 现在,让我们看看与其他大陆相比,每个大陆的销售情况如何,为此,我们将计算每个大陆的折扣和销售平均值,
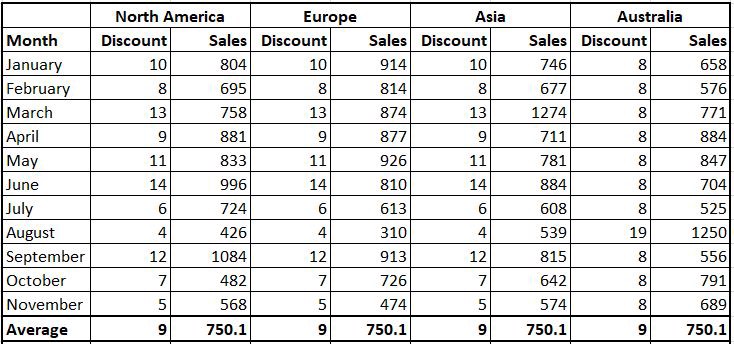
It looks like the Sales have been pretty equal across the continents for the first 11 months. Let’s also take a look at the Standard Deviation of each column by further inspecting the data,
前11个月,各大洲的销售情况似乎相当。 让我们通过进一步检查数据来查看每列的标准差,
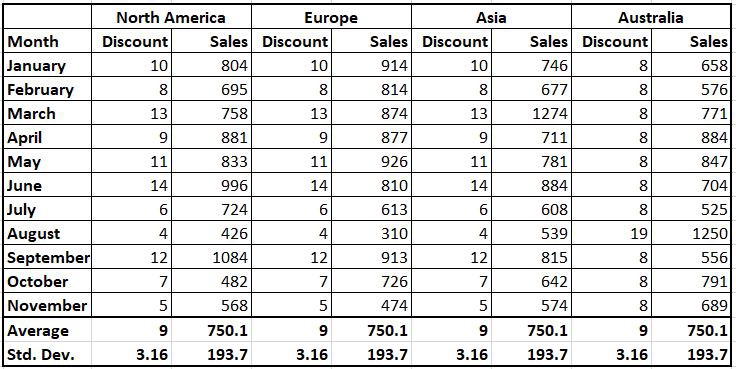
So, by the above data, we can infer that the performance of the sales has been the same when compared to the continents. See, this is where t
 最低0.47元/天 解锁文章


 3万+
3万+


 被折叠的 条评论
为什么被折叠?
被折叠的 条评论
为什么被折叠?
 到【灌水乐园】发言


