


数据透视表和数据交叉表
Consider the data of healthcare drugs as provided in the excel sheet. The concept of pivot tables in python allows you to extract the significance from a large detailed dataset. A pivot table helps in tracking only the required information from the data frames. It summarizes the data. The panda’s pivot table is a good alternative instead of using other tools for analysing the data. The following are the features for using panda’s pivot table.
考虑excel表中提供的保健药物数据。 python中数据透视表的概念使您可以从大型详细数据集中提取重要性。 数据透视表有助于仅跟踪数据帧中所需的信息。 它汇总了数据。 熊猫的数据透视表是一个很好的选择,而不是使用其他工具来分析数据。 以下是使用熊猫数据透视表的功能。
- It is quicker. 它更快。
- It is self-documenting 它是自我记录
- It is easy to use for generating a report or email 易于生成报告或电子邮件
- It is more flexible in defining the aggregation functions. 定义聚合函数时更加灵活。
Consider this below dataset for execution. Download the dataset which is available here. In this article, you will learn python pivots with many examples.
在下面的数据集中考虑执行。 下载可在此处获得的数据集。 在本文中,您将通过许多示例学习python数据透视。
The pivot table must have a data frame and an index. Run the below code which has used “Patient Name” as an index.
数据透视表必须具有数据框和索引。 运行以下使用“患者姓名”作为索引的代码。
Example 1:
范例1:
import pandas as pdimport numpy as npdf = pd.read_excel(“C:\\Users\\admin\\Desktop\\drugs.xlsx”)data = pd.pivot_table(df,index=[“Patient Name”])print(data)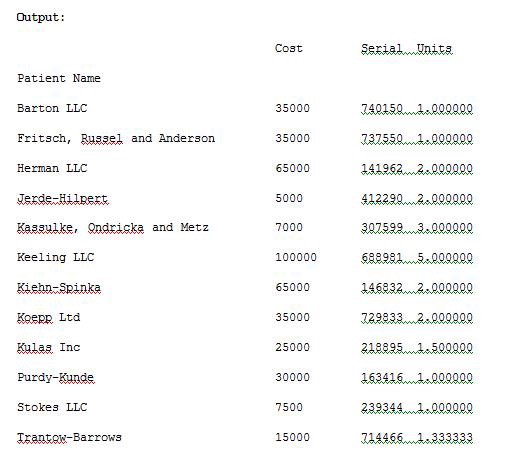
The pd.pivot_table(df,index=[“Patient Name”])will track the data with “Patient Name” as index. We can also track the data with multiple indexes by providing multiple arguments to the index variable. Run the below Example 2 to see the result.
pd.pivot_table(df,index = [“患者名称”])将以“患者名称”作为索引来跟踪数据。 我们还可以通过为index变量提供多个参数来跟踪具有多个索引的数据。 运行下面的示例2以查看结果。
Example 2:
范例2:
import pandas as pdimport numpy as npdf = pd.read_excel(“C:\\Users\\admin\\Desktop\\drugs.xlsx”)data = pd.pivot_table(df,index=[“Patient Name”,”Jr Doctor”,”Sr Doctor”])pd.set_option(‘display.max_columns’,None)print(data)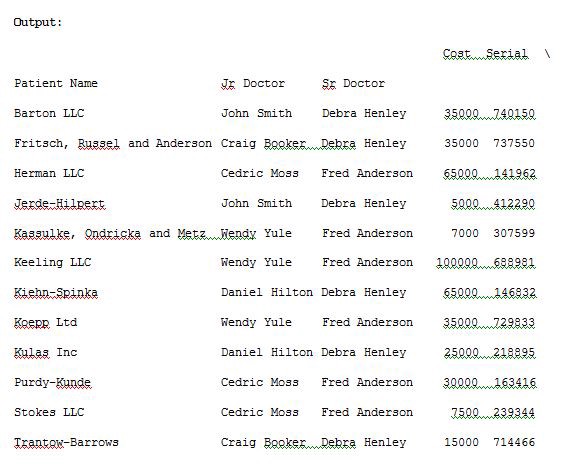
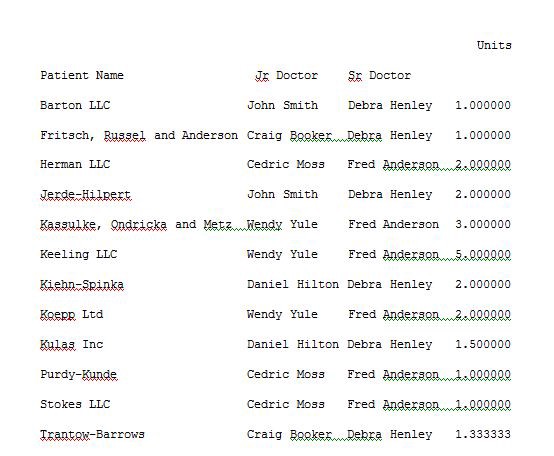
In the above program I have used pd.set_option(‘display.max_columns’,None)for displaying all the columns in a data frame so as to make it visible in a terminal output window during the program execution. The pd.pivot_table(df,index=[“Patient Name”,”Jr Doctor”,”Sr Doctor”])data will now track the data with the corresponding index names. For suppose if we don’t want Serial and Units columns as it is not useful than we can explicitly remove these columns by providing the values field. Run the below code of Example 3 to see the result.
在上面的程序中,我使用了pd.set_option('display.max_columns',None)来显示数据框中的所有列,以便在程序执行期间使其在终端输出窗口中可见。 现在,pd.pivot_table(df,index = [“患者姓名”,“小医生”,“高级医生”])数据将跟踪具有相应索引名的数据。 假设如果我们不想使用Serial和Units列,因为它没有用,那么我们可以通过提供values字段显式删除这些列。 运行下面的示例3的代码以查看结果。
Example 3:
范例3:
import pandas as pdimport numpy as npdf = pd.read_excel(“C:\\Users\\admin\\Desktop\\drugs.xlsx”)data = pd.pivot_table(df,index=[“Sr Doctor”,”Jr Doctor”],values=[“Units”])pd.set_option(‘display.max_columns’,None)print(data)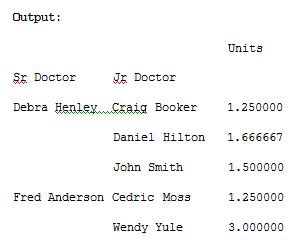
We can use aggfunc and np.sum to get the count or a sum for the cost column automatically by using it as an argument in pivot_table()method.
我们可以使用aggfunc和np.sum来自动获取成本列的计数或总和,方法是将其用作pivot_table()方法中的参数。
Example 4:
范例4:
import pandas as pdimport numpy as npdf = pd.read_excel(“C:\\Users\\admin\\Desktop\\drugs.xlsx”)data = pd.pivot_table(df,index=[“Sr Doctor”,”Jr Doctor”],values=[“Cost”],aggfunc=np.sum)pd.set_option(‘display.max_columns’,None)print(data)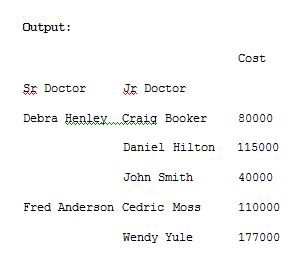
The aggfunc argument can take list of functions. We can compute the mean using numpy and len to get the count.
aggfunc参数可以接受功能列表。 我们可以使用numpy和len计算平均值以获得计数。
Example 5:
范例5:
import pandas as pdimport numpy as npdf = pd.read_excel(“C:\\Users\\admin\\Desktop\\drugs.xlsx”)data = pd.pivot_table(df,index=[“Sr Doctor”,”Jr Doctor”],values=[“Cost”],aggfunc=[np.sum,len])pd.set_option(‘display.max_columns’,None)print(data)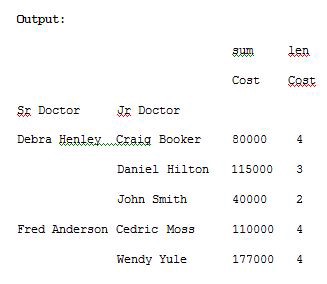
The columns are optional. They provide an additional way to segment the actual values you care about. The aggregation functions are applied to the values you list. Look at Example 6 for understanding.
列是可选的。 它们提供了另外一种细分实际值的方法。 聚合函数将应用于您列出的值。 请参阅示例6进行理解。
Example 6:
范例6:
import pandas as pdimport numpy as npdf = pd.read_excel(“C:\\Users\\admin\\Desktop\\drugs.xlsx”)data = pd.pivot_table(df,index=[“Sr Doctor”,”Jr Doctor”],values=[“Cost”],columns=[“Drug”],aggfunc=[np.sum])pd.set_option(‘display.max_columns’,None)print(data)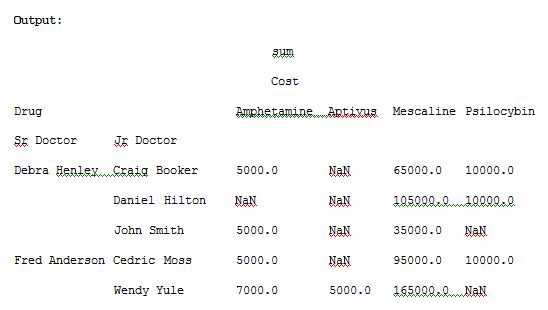
The NaN’s values can be replaced with 0 by passing fill_value argument for pivot_table() method. Run the Example 7 code and see the result.
NaN的值可以通过将ivot_table()方法的fill_value参数传递给0来替换。 运行示例7代码,然后查看结果。
Example 7:
范例7:
import pandas as pdimport numpy as npdf = pd.read_excel(“C:\\Users\\admin\\Desktop\\drugs.xlsx”)data = pd.pivot_table(df,index=[“Sr Doctor”,”Jr Doctor”],values=[“Cost”],columns=[“Drug”],aggfunc=[np.sum],fill_value=0)pd.set_option(‘display.max_columns’,None)print(data)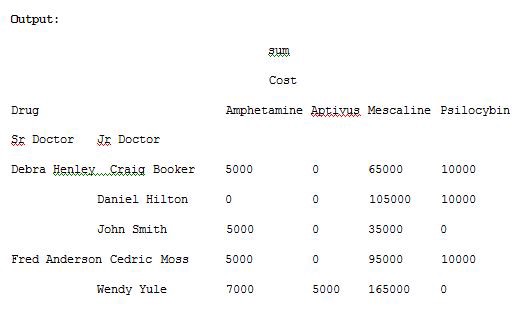
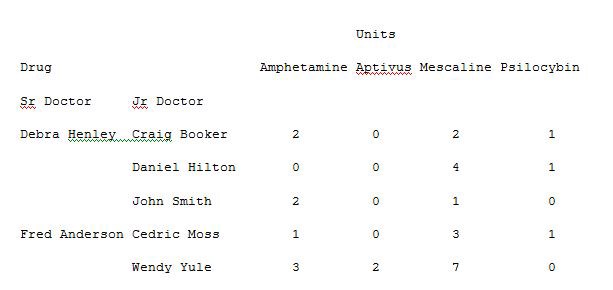
Now let us add units to the values list and execute the code, run the code in Example 8 and see the result.
现在,让我们将单元添加到值列表中并执行代码,运行示例8中的代码并查看结果。
Example 8:
范例8:
import pandas as pdimport numpy as npdf = pd.read_excel(“C:\\Users\\admin\\Desktop\\drugs.xlsx”)data = pd.pivot_table(df,index=[“Sr Doctor”,”Jr Doctor”],values=[“Cost”,”Units”],columns=[“Drug”],aggfunc=[np.sum],fill_value=0)pd.set_option(‘display.max_columns’,None)print(data)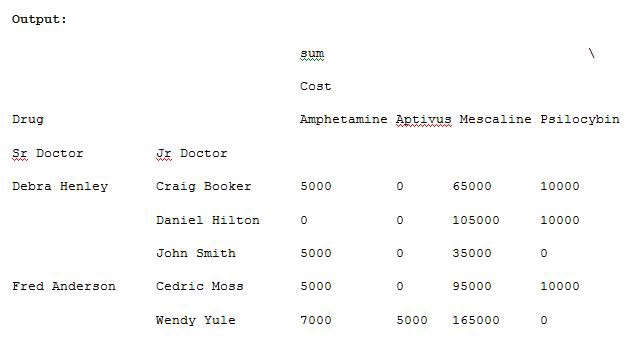
Now let us remove the drug from the columns and add this to the index. Run the below code in Example 9 to get a different visual representation.
现在,让我们从列中删除药物并将其添加到索引中。 在示例9中运行以下代码,以获取不同的视觉表示。
Example 9:
范例9:
import pandas as pdimport numpy as npdf = pd.read_excel(“C:\\Users\\admin\\Desktop\\drugs.xlsx”)data = pd.pivot_table(df,index=[“Sr Doctor”,”Jr Doctor”,”Drug”],values=[“Cost”,”Units”],aggfunc=[np.sum],fill_value=0)pd.set_option(‘display.max_columns’,None)print(data)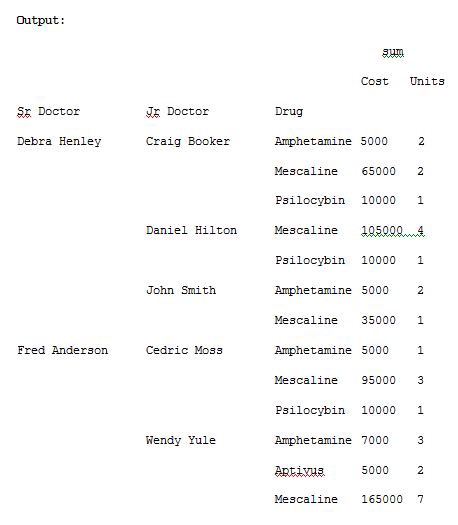
To see the totals for cost and units of sum and mean, use margins=True. Run the below code and see the result.
要查看成本总计以及总和和均值的单位,请使用margins = True。 运行以下代码,然后查看结果。
Example 10:
范例10:
import pandas as pdimport numpy as npdf = pd.read_excel(“C:\\Users\\admin\\Desktop\\drugs.xlsx”)data = pd.pivot_table(df,index=[“Sr Doctor”,”Jr Doctor”,”Drug”],values=[“Cost”,”Units”],aggfunc=[np.sum,np.mean],fill_value=0,margins=True)pd.set_option(‘display.max_columns’,None)print(data)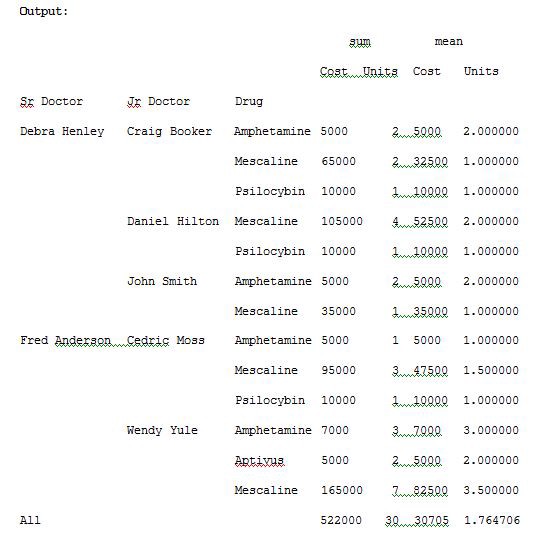
Let us now track the Sr Doctor level and track how the outcome is ordered. Run the below code of Example 11 for understanding.
现在让我们跟踪高级医生的水平并跟踪结果的排序方式。 运行以下示例11的代码以进行理解。
Example 11:
示例11:
import pandas as pdimport numpy as npdf = pd.read_excel(“C:\\Users\\admin\\Desktop\\Drugs.xlsx”)data = pd.pivot_table(df,index=[“Sr Doctor”,”Outcome”],values=[“Cost”],aggfunc=[np.sum],fill_value=0,margins=True)pd.set_option(‘display.max_columns’,None)print(data)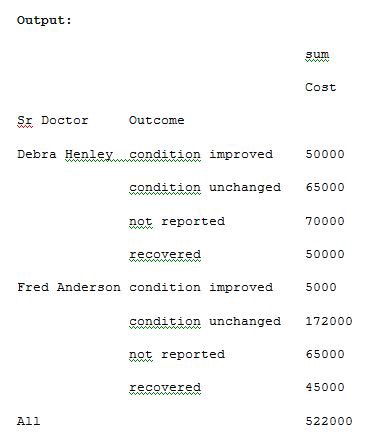
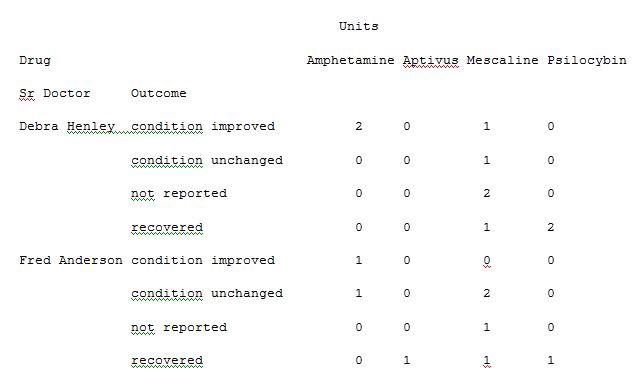
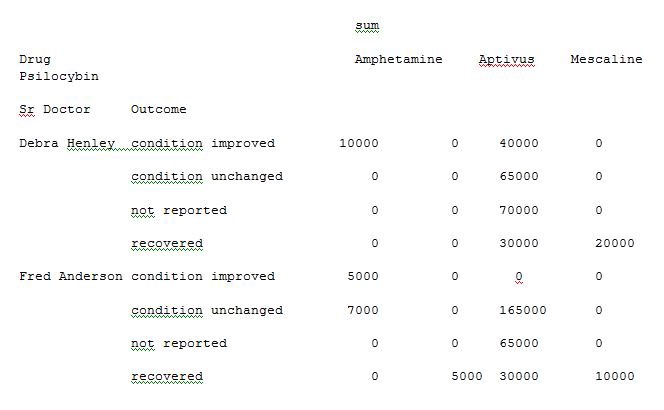
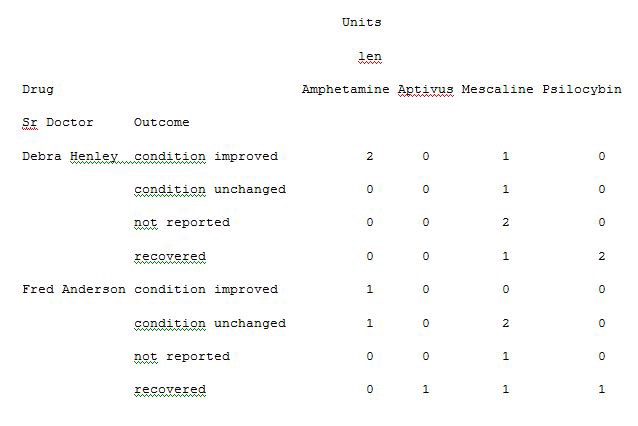
We can also pass a dictionary to the aggfunc argument to perform different functions on each of the values which you select. Run Example 12 code and see the result.
我们还可以将字典传递给aggfunc参数,以对您选择的每个值执行不同的功能。 运行示例12代码,然后查看结果。
Example 12:
范例12:
import pandas as pdimport numpy as npdf = pd.read_excel(“C:\\Users\\admin\\Desktop\\Drugs.xlsx”)data = pd.pivot_table(df,index=[“Sr Doctor”,”Outcome”],columns=[“Drug”],values=[“Units”,”Cost”],aggfunc={“Units”:len,”Cost”:np.sum},fill_value=0)pd.set_option(‘display.max_columns’,None)print(data)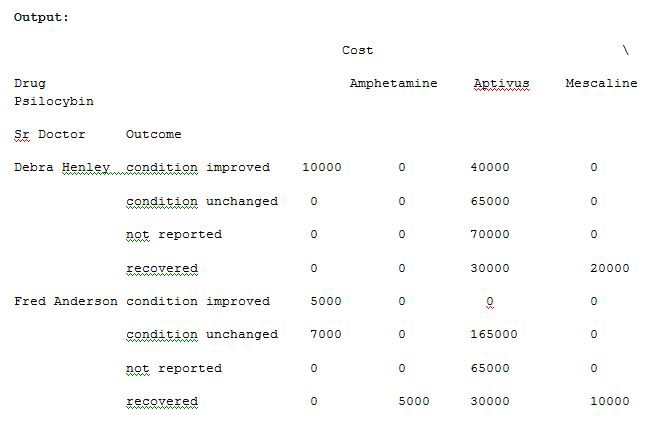
We can also provide the list for each value while passing a dictionary for aggfunc argument. Run the below code in Example 13 to see the result.
我们还可以为每个值提供列表,同时传递aggfunc参数的字典。 在示例13中运行以下代码以查看结果。
Example 13:
示例13:
import pandas as pdimport numpy as npdf = pd.read_excel(“C:\\Users\\admin\\Desktop\\Drugs.xlsx”)data = pd.pivot_table(df,index=[“Sr Doctor”,”Outcome”],columns=[“Drug”],values=[“Units”,”Cost”],aggfunc={“Units”:len,”Cost”:[np.sum,np.mean]},fill_value=0)pd.set_option(‘display.max_columns’,None)print(data)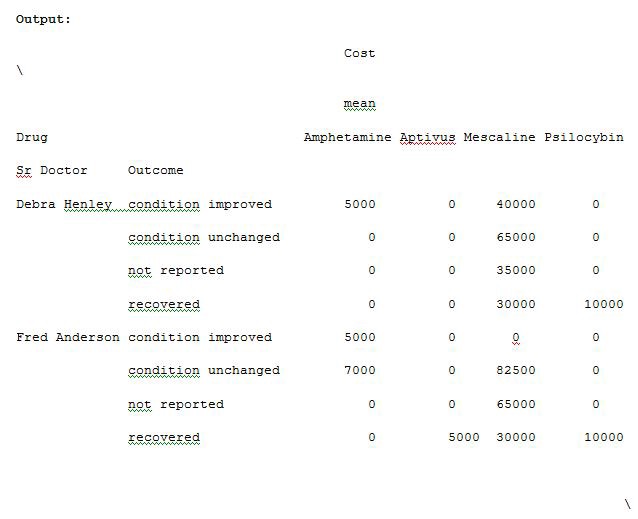
Thus you are able to extract and analyse the data from an excel sheet of a Microsoft product by applying the concept of a pivot table in python instead of using tools for analysis. The data analysis becomes very easy for understanding and is also very quick at processing the pivot table with python execution.
因此,您可以通过使用python中的数据透视表而不是使用分析工具来从Microsoft产品的Excel工作表中提取和分析数据。 数据分析变得非常容易理解,并且在使用python执行处理数据透视表时也非常快。
翻译自: https://medium.com/analytics-vidhya/data-extraction-with-pivot-tables-a7d980c18dd0
数据透视表和数据交叉表


 1348
1348

 被折叠的 条评论
为什么被折叠?
被折叠的 条评论
为什么被折叠?
 到【灌水乐园】发言


