


react获取api
React is a nice JavaScript framework that allows developers to create interfaces by implementing simple building blocks called components. What sets react apart from more traditional web development frameworks is that it automatically uses its internal logic to render the section of the user interface that needs to be updated based on props and state changes (more on that later).
React是一个很好JavaScript框架,允许开发人员通过实现称为组件的简单构建块来创建接口。 与更传统的Web开发框架不同的是,它会自动使用其内部逻辑来呈现需要基于props和状态更改进行更新的用户界面部分(稍后将对此进行详细介绍)。
In this tutorial, we are going to call a stock market prices API to design a graph using the library “recharts.js”.
在本教程中,我们将调用股票市场价格API以使用“ recharts.js”库设计图形。
To unlock the full potential of the react framework, simply type the below commands on the command line .
要释放React框架的全部潜力,只需在命令行上键入以下命令。
create-react-app apisThis will help create a new project called apis (or whatever else you want to call it 😀). We will also use the command line to install recharts.
这将有助于创建一个名为apis的新项目(或其他您要称为😀的项目)。 我们还将使用命令行来安装图表。
npm install recharts Once you are done with those steps, go to your app.js and add the following code 👇. This code will render the graph component that you will implement in a file called graph.js
完成这些步骤后,转到app.js并添加以下代码👇。 此代码将呈现要在名为graph.js的文件中实现的图形组件
import React from 'react';
import Graph from './graph';function App() {return (<Graph/>);}export default App;
In graph.js, we need to first import the important dependencies for this project.
在graph.js中,我们需要首先导入该项目的重要依赖关系。
import React from "react"import { useState, useEffect } from "react";import {Line, LineChart, Tooltip} from 'recharts'useState is a react hook which allows functional components to manage react states.
useState是一个React挂钩,允许功能组件管理React状态。
UseEffect is a functional implementation of componentDidMount,componentDidUpdate, and componentWillUnmount
UseEffect是componentDidMount , componentDidUpdate和componentWillUnmount的功能实现
Before we implement the get requests , we need to head over to this website to get our API key.
在实施get请求之前,我们需要前往该网站以获取我们的API密钥。
Our graph.js file will look like this:
我们的graph.js文件将如下所示:
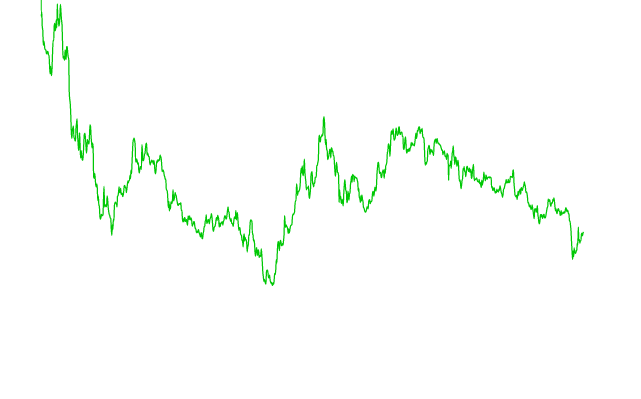
//this line imports react functionalityimport React from 'react';import { useEffect, useState } from "react";import { LineChart, Line, Tooltip } from 'recharts';export default function App() {const [error, setError] = useState(null);const [isLoaded, setIsLoaded] = useState(false);const [items, setItems] = useState([]);const data = [];// Note: the empty deps array [] means// this useEffect will run once// similar to componentDidMount()useEffect(() => {fetch("https://www.alphavantage.co/query?function=TIME_SERIES_WEEKLY&symbol=IBM&apikey=" + process.env.REACT_API).then(res => res.json()).then((result) => {for (var instance in result["Weekly Time Series"] ) {var mydata = (result["Weekly Time Series"][instance])mydata.date= instancedata.push(mydata)}setItems(data.reverse())},// Note: it's important to handle errors here// instead of a catch() block so that we don't swallow// exceptions from actual bugs in components.(error) => {setIsLoaded(true);setError(error);})}, [])return (<div><LineChart width={500} height={250} margin={{ top: 150, right: 30, left: 20, bottom: 5 }} data={items}><Line dot={false} type="monotone" dataKey="1. open" stroke="rgb(0,200,5)" yAxisId="100" /></LineChart></div>)}This React code generates the graph below 👇:
此React代码生成以下图👇:
let’s back up for a second and try to understand the react code by breaking it down . For a better grasp of the explanation, you can print the data response in the console with console.log(result)
让我们备份一秒钟,然后尝试通过分解来了解React代码。 为了更好地理解该说明,您可以使用console.log(result)在控制台中打印数据响应。
useEffect(() => {fetch("https://www.alphavantage.co/query?function=TIME_SERIES_WEEKLY&symbol=IBM&apikey=" + process.env.REACT_API).then(res => res.json()).then((result) => {for (var instance in result["Weekly Time Series"] ) {var mydata = (result["Weekly Time Series"][instance])mydata.date= instancedata.push(mydata)}setItems(data.reverse())},// Note: it's important to handle errors here// instead of a catch() block so that we don't swallow// exceptions from actual bugs in components.(error) => {setIsLoaded(true);setError(error);})}, [])Because of useEffect , the above code is only going to run when the variables specified in the corresponding array [] are modified. In this case, the array is empty. This means that the code will only run once (At loading time).
由于useEffect ,以上代码仅在相应数组[]中指定的变量被修改时才运行。 在这种情况下,数组为空。 这意味着代码将仅运行一次(在加载时)。
The fetch method allows us to make an HTTP request to the stock API
fetch方法允许我们向库存API发出HTTP请求
We specify
function= TIME_SERIES_WEEKLYwhich gives us access to one thousand weeks of stock data.我们指定
function= TIME_SERIES_WEEKLY,这使我们可以访问一千周的库存数据。We also specify
Symbol= MSFTto request Microsoft stock data.我们还指定
Symbol= MSFT来请求Microsoft股票数据。process.env.REACT_APPretrieves the API key from the .env fileprocess.env.REACT_APP从.env文件检索API密钥It is important to notice that the data is reversed with
data.reverse()before being stored in the state-array. This is done to prevent the graph from displaying from right to left (We want most recent values to display on the right)重要的是要注意,在将数据存储在状态数组中之前,已使用
data.reverse()将其反转。 这样做是为了防止图形从右向左显示(我们希望最新值显示在右侧)
Now, let’s analyze the recharts part of the code.
现在,让我们分析代码的图表部分。
Width and height help to specify the dimensions of the graph.
宽度和高度有助于指定图形的尺寸。
The dot prop is set to false to erase the dots.
点道具 设定为 为false删除点。
The state-array items is passed to the data prop to generate the intended graph. However, there are several values in the state-array; therefore to specify that we are interested in the opening price of the stock for that day. We use the prop dataKey. In our case, we specify
dataKey=”1. open”.将状态数组项传递到数据道具以生成预期的图。 但是,状态数组中有多个值。 因此,请指定我们对当天股票的开盘价感兴趣。 我们使用道具dataKey。 在我们的例子中,我们指定
dataKey=”1. open”dataKey=”1. open”。
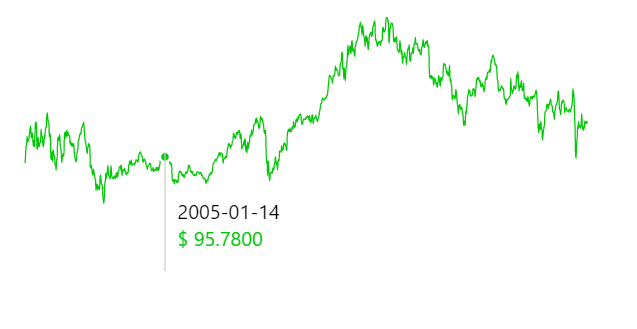
<LineChart width={500} height={250} margin={{ top: 150, right: 30, left: 20, bottom: 5 }} data={items}><Line dot={false} type="monotone" dataKey="1. open" stroke="rgb(0,200,5)" yAxisId="100" /></LineChart>We can customize the tool tip to show the specific stock values for a particular stock on a specific day when we hover over the graph. To do that, we can use the <tooltip /> component along with a customTooltip function.
当我们将鼠标悬停在图表上时,我们可以自定义工具提示以显示特定日期特定股票的特定股票价值。 为此,我们可以将<tooltip />组件与customTooltip函数一起使用。
We will add the following line 👇 to our linechart component:
我们将以下行add添加到线图组件中:
<Tooltip content={<CustomTooltip data={items} />} />This line of code passes the items array to the data prop available in the Tooltip component.
此行代码将items数组传递到Tooltip组件中可用的data prop。
We define our customTooltip function as follows:
我们定义如下的customTooltip函数:
function CustomTooltip(props) {var price = ""var date = ""console.log(props)if (props.data[props.label]) {price = props.data[props.label]["1. open"]date = props.data[props.label]["date"]}return (<div><div >{date} </div><div style={{ color: "rgb(0,200,5)"}}> $ {price}</div></div>)}This code uses the label prop and the date prop to generate this customized tool tip.
此代码使用标签属性和日期属性来生成此定制工具提示。
😊 Hope this tutorial helped with Recharts and fetching data from APIS in react. Check out the code on GitHub. Feel free to interact with me in the comment section.
😊希望本教程对Recharts和从APIS中获取数据有帮助。 在GitHub上查看代码。 请随时在评论部分与我互动。
Find me on LinkedIn 🔥
在LinkedIn上找到我
react获取api


 191
191

 被折叠的 条评论
为什么被折叠?
被折叠的 条评论
为什么被折叠?
 到【灌水乐园】发言


