


谷歌devtool
何时使用“网络”面板 (When to use the Network panel)
Network tab or panel in Chrome Devtool is one of the most popular debugging tools that software developers especially Web & Front-End developer can use
Chrome Devtool中的“网络”标签或面板是软件开发人员(尤其是Web和前端开发人员)可以使用的最受欢迎的调试工具之一
The most common use cases for the Network panel are
网络面板最常见的用例是
- Making sure that resources are actually being uploaded or downloaded at all 确保实际上实际上是在上载或下载资源
- Inspecting the properties of an individual resource, such as its HTTP headers, content, size, and so on 检查单个资源的属性,例如其HTTP标头,内容,大小等
介绍 (Intro)
I believe that many readers of this article have an experience of using Chrome Devtool at least once. Inspecting the status codes such as 2xx (Success), 4xx Client Error, 5xx Server Error, for example, is one of the common practices software engineers do to see if HTTP request/response is safely delivered to/from the server
我相信本文的许多读者都有使用Chrome Devtool至少一次的经验。 例如,检查状态码(例如2xx(成功),4xx客户端错误,5xx服务器错误)是软件工程师查看HTTP请求/响应是否安全地从服务器传递或从服务器传递的一种常见做法。
There are more features [Network] tab of Chrome DevTools offer and let’s find out some of their features that make your debugging much easier
Chrome DevTools提供了更多功能[网络]标签,让我们找出其中的一些功能可以使调试更加轻松
For a better explanation, I will take screenshots from Chrome DevTools opened from CNBC Youtube video called Do You Need A College Degree To Be Happy?
为了获得更好的解释,我将截取CNBC Youtube视频中打开的Chrome DevTools的屏幕截图,该视频称为“您是否需要大学学位才能开心?

秘诀1 (Tip 1)
Show more information
显示更多信息
There are many columns that are hidden by default which you may find useful. You can right-click the header of the Network Log table and select columns you want to display
默认情况下,有许多隐藏的列可能对您有用。 您可以右键单击“网络日志”表的标题,然后选择要显示的列

秘诀2 (Tip 2)
Simulate a slower network connection
模拟较慢的网络连接
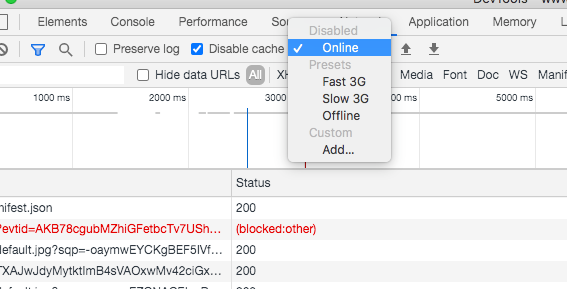
By throttling the page you can get a better idea of how long a page takes to load on a slower network environment such as mobile device
通过限制页面,您可以更好地了解页面在较慢的网络环境(例如移动设备)上加载需要花费多长时间
You can choose from Fast 3G, Slow 3G, Offline, Online options
您可以选择快速3G,慢速3G,离线,在线选项
秘诀3 (Tip 3)
HAR File: Import / Export network logs
HAR文件:导入/导出网络日志
HAR, short for HTTP Archive, is a format used for tracking information between a web browser and a website. HAR file is often very useful when you communicate with other FrontEnd / BackEnd developers and explain what is happening in your browser network tab. HAR file helps other developers to simulate your network logs easily by importing in their browser network tabs and it significantly reduces potential miscommunications
HAR,是HTTP Archive的缩写,是一种用于在Web浏览器和网站之间跟踪信息的格式。 当您与其他FrontEnd / BackEnd开发人员进行交流并解释浏览器网络选项卡中发生的情况时,HAR文件通常非常有用。 HAR文件可通过导入其他浏览器的“网络”标签来帮助其他开发人员轻松地模拟您的网络日志,并大大减少了潜在的误传

秘诀4 (Tip 4)
Save requests across page loads
保存跨页面加载的请求
All of your previous network logs disappears when you “refresh” your page. To save requests across page loads, check the Preserve log checkbox on the network panel. DevTools saves all requests until you disable Preserve log
当您“刷新”页面时,所有以前的网络日志都会消失。 要保存跨页面加载的请求,请选中网络面板上的“ 保留日志”复选框。 DevTools将保存所有请求,直到禁用“ 保留日志”为止

秘诀5 (Tip 5)
Replay XHR request
重播XHR请求
You could replay an XHR request by rick-click the request in the Requests table and select Replay XHR. It’s useful when you want to make the same requests once again without explicitly triggering any events. You have an option to Replay XHR only for XHR requests (In the example, I filter the requests by XHR)
您可以通过在“请求”表中单击鼠标右键并重播XHR请求,然后选择“ 重播XHR”。 当您想再次发出相同的请求而不显式触发任何事件时,这很有用。 您可以选择仅针对XHR请求重播XHR (在示例中,我按XHR过滤了请求)

秘诀6 (Tip 6)
Add Custom Columns
添加自定义列
You could add a custom column to the Requests table by right-clicking the header of the Requests table and select Response Headers > Manage Header Columns
您可以通过右键单击Requests表的标题,然后选择Response Headers> Manage Header Columns,将自定义列添加到Requests表中

秘诀7 (Tip 7)
Cache and Reload
缓存并重新加载
You could see 3 options for reloading if you open the devtools and clicks the “reload” icon for about 1~2 seconds. The difference between Normal Reload and Hard Reload depends on whether you want to use anything in the cache.
如果您打开devtools并单击“重新加载”图标大约1到2秒钟,则可以看到3个重新加载选项。 正常重载和硬重载之间的区别取决于您是否要在缓存中使用任何内容。
Normal reload — The same thing as pressing “F5”
正常重新加载-与按“ F5”相同
Hard reload — Force the browser do re-download every JavaScript file, image, text, file, etc
硬重装-强制浏览器重新下载每个JavaScript文件,图像,文本,文件等
It’s good for testing initial rendering speed for the end-users
这对于测试最终用户的初始渲染速度非常有用

结论 (Conclusion)
Chrome DevTools is one of the strongest debugging tools available for developers. Hope you have something to take away from reading this article and happy coding & debugging! Thank you!
Chrome DevTools是可供开发人员使用的最强大的调试工具之一。 希望您能从阅读本文以及愉快的编码和调试中受益匪浅! 谢谢!
普通英语JavaScript (JavaScript In Plain English)
Did you know that we have three publications and a YouTube channel? Find links to everything at plainenglish.io!
您知道我们有三个出版物和一个YouTube频道吗? 在plainenglish.io上找到所有内容的链接!
谷歌devtool


 119
119

 被折叠的 条评论
为什么被折叠?
被折叠的 条评论
为什么被折叠?
 到【灌水乐园】发言


