


根据时间段生成重叠时间
In data science world, people tend to think cleaning data is boring and desire more of machine learning and modeling challenges, but sometimes some problems might arise like a fun brain teaser or an algorithmic puzzle during data cleaning. Here’s a fun one I recently ran into when I am cleaning an event table. It’s not anything like crazy ML algorithms or new cool python tools but a small interesting problem worth couple minutes to figure out.
在数据科学世界中,人们倾向于认为清理数据很无聊,并且希望有更多的机器学习和建模挑战,但是有时可能会出现一些问题,例如在清理数据时出现有趣的脑筋急转弯或算法难题。 这是我最近在清理事件表时遇到的一个有趣事件。 它不是疯狂的ML算法或新的酷python工具,而是一个值得花几分钟才能弄清楚的小问题。
Event table is pretty common when we are building any kind of data pipeline or ML pipeline, especially when we are dealing with prediction problem. An event table is like a transaction table which normally has a start time, end time, person ID and other event attributes. Each row is an event and some events might overlap which could be a problem. An event table in real world might look like this:
当我们构建任何类型的数据管道或ML管道时,事件表都是很常见的,尤其是在处理预测问题时。 事件表就像事务表,通常具有开始时间,结束时间,人员ID和其他事件属性。 每行都是一个事件,某些事件可能会重叠,这可能是一个问题。 现实世界中的事件表可能如下所示:
   person_id      start        end
0          1 2017-01-01 2017-06-01
1          1 2017-02-01 2017-03-01
2          1 2017-05-01 2017-08-01
3          1 2017-09-01 2017-10-01
4          1 2017-11-01 2018-02-01
5          1 2018-01-01 2018-03-01
Sometimes we can just live with it, but sometimes we want to merge those overlapping rows into one row with the earliest start time and the latest end time like this:
有时我们可以忍受,但是有时我们想将重叠的行合并为最早的开始时间和最新的结束时间,如下所示:
   person_id      start        end
0          1 2017-01-01 2017-08-01
1          1 2017-09-01 2017-10-01
2          1 2017-11-01 2018-03-01
That being said, since the second event and the third event both overlap with the first event even though the third event doesn’t overlap with the second event, we would like the merged event to have the first event’s start time and the third event’s end time. It looks pretty simple but it’s not so straightforward to figure out a good solution.
话虽如此,因为即使第三事件与第二事件不重叠,第二事件和第三事件都与第一事件重叠,所以我们希望合并事件具有第一事件的开始时间和第三事件的结束时间时间。 看起来很简单,但要找到一个好的解决方案并不是那么简单。
Here I am solving this in python.
在这里,我正在用python解决这个问题。
Simple case:
简单的情况:
First solution, we can treat this as a graph connectivity problem. Each event is a node. If two events overlap, then they connect with an edge. Therefore, the first three events will form a connected sub-graph, the third event is an isolated node kind of sub-graph, and the forth and fifth events will form another connected sub-graph. We assign each sub-graph a group_id in the original DataFrame. Now we can group by the group_id and aggregate by min(start time) and max(end time) and then we have the answer.
第一种解决方案,我们可以将其视为图形连接问题。 每个事件都是一个节点。 如果两个事件重叠,则它们将连接一条边。 因此,前三个事件将形成一个连接的子图,第三个事件是一个孤立节点类型的子图,而第四和第五个事件将形成另一个连接的子图。 我们在原始DataFrame中为每个子图分配一个group_id。 现在我们可以按group_id分组,并按min(开始时间)和max(结束时间)进行汇总,然后得出答案。
To implement that, first we will create an adjacency matrix to represent the graph. First we want to define “overlap”. Overlap here means: for any two nodes A and B. If node A’s start date is before node B’s end date and node A’s end date is after node B’s start date, then A and B overlap. We can implement the logic with numpy array to create a sparse matrix. There are several algorithms existed to solve the connectivity graph problem. We can just use one of the off-the-shelf functions from scipy.sparse.csgraph.connected_components to achieve this. scipy implement the function with something similar to Tarjan’s algorithm. Then, we just do the simple pandas groupbymethod to get the result we want.
为此,首先我们将创建一个邻接矩阵来表示图。 首先,我们要定义“重叠”。 此处的重叠意味着:对于任何两个节点A和B。如果节点A的开始日期在节点B的结束日期之前,并且节点A的结束日期在节点B的开始日期之后,则A和B重叠。 我们可以使用numpy数组实现逻辑来创建稀疏矩阵。 存在几种解决连通图问题的算法。 我们可以仅使用scipy.sparse.csgraph.connected_components的现有功能scipy.sparse.csgraph.connected_components来实现此目的。 scipy使用类似于Tarjan算法的方法来实现该功能。 然后,我们只需要简单的pandas groupby方法就可以得到想要的结果。
This is a pretty solution for its mathematical approach. That’s just for one person. If we have thousand or million people, which is normally the real world case, the graph will grow very large and the space complexity it’s gonna grow in n². We can still implement this by adding another “&” logic in the line of creating the adjacency matrix.
这是其数学方法的不错的解决方案。 那只适合一个人。 如果我们有成千上万的人(通常是现实世界中的情况),则图将变得非常大,并且空间复杂度将以n²增长。 我们仍然可以通过在创建邻接矩阵的行中添加另一个“&”逻辑来实现这一点。
def graph_approach(df, key='person_id', start='start', end='end'):
    start = df[start]values
    end = df[end]values
    person_id = df[person_id]values
    graph = (start <= end[:, None]) & (end >= start[:, None]) & (person_id == person_id[:, None])
    n_components, indices = connected_components(graph, directed=False)
    return df.groupby(indices).aggregate({'person_id': 'first', 'start': 'min','end': 'max'})
Theoretically, the time complexity of Tarjan’s algorithm is linear. The n^2 space complexity makes it not able to scale. This made me think about how to solve it in a scalable way along with pandas.
从理论上讲,Tarjan算法的时间复杂度是线性的。 n^2空间复杂度使其无法缩放。 这使我想到了如何与pandas一起以可扩展的方式解决它。
Honestly, I am not a fan of pandas due to its unintuitive way of querying things, but it does provide good performance if we can have a vectorized solution.
老实说,我不喜欢pandas因为它的查询方式不直观,但是如果我们有矢量化的解决方案,它的确可以提供良好的性能。
The vectorized solution is like this.
向量化的解决方案就是这样。
def vectorized_approach(df, key='person_id', start='start', end='end'):
    df = df.copy()
    # start_end is an indicator for start or end
    startdf = pd.DataFrame({key: df[key], 'time': df[start], 'start_end': 1})
    enddf = pd.DataFrame({key: df[key], 'time': df[end], 'start_end': -1})
    # concat and sort the whole thing by key and time
    mergedf = pd.concat([startdf, enddf]).sort_values([key, 'time'])
    # use cumsum to create gaps and islands
    mergedf['cumsum'] = mergedf.groupby(key)['start_end'].cumsum()
    # assign new start date
    mergedf['new_start'] = mergedf['cumsum'].eq(1) & mergedf['start_end'].eq(1)
    # use cumsum to assign group id
    mergedf['group'] = mergedf.groupby(key)['new_start'].cumsum()
    # group_id by choosing the start_date row
    df['group_id'] = mergedf['group'].loc[mergedf['start_end'].eq(1)]


    return df.groupby([key, 'group_id']).aggregate({start: min, end: max}).reset_index()
Let’s forget about all the graph and nodes and edges and rethink this problem with some pure simple time series data. First of all, we break the start time and end time to create an one dimensional time series by sorting it. We have a column start_end to indicate if it's a start time or an end time where1 is start time and -1 is end time. Then we perform a cumulative sum on the series as the column cumsum. By looking at it, we notice that a new start time is a start time where its cumsum is 1 and a new end time is an end time where its cumsum is 0. So now we have a new_start column. Next, we perform another cumulative sum on the new_start column to get the group_id. Last, we do the same aggregation to get the answer.
让我们忘掉所有的图形,节点和边,并用一些纯简单的时间序列数据重新考虑这个问题。 首先,我们通过对开始时间和结束时间进行排序来创建一维时间序列。 我们有一列start_end来指示它是开始时间还是结束时间,其中1是开始时间, -1是结束时间。 然后,我们对该系列执行累加总和作为列cumsum 。 通过查看它,我们注意到新的开始时间是其cumsum为1的开始时间,而新的结束时间是其cumsum为0的结束时间。 现在,我们有了一个new_start列。 接下来,我们在new_start列上执行另一个累加总和,以获得group_id 。 最后,我们进行相同的汇总以获得答案。
It’s probably easier to look at the mergedf to understand what's going on here.
看一下mergedf可能更容易理解这里发生的事情。
   person_id       time  start_end  cumsum  new_start  group
0          1 2017-01-01          1       1       True    1.0
1          1 2017-02-01          1       2      False    1.0
1          1 2017-03-01         -1       1      False    1.0
2          1 2017-05-01          1       2      False    1.0
0          1 2017-06-01         -1       1      False    1.0
2          1 2017-08-01         -1       0      False    1.0
3          1 2017-09-01          1       1       True    2.0
3          1 2017-10-01         -1       0      False    2.0
4          1 2017-11-01          1       1       True    3.0
5          1 2018-01-01          1       2      False    3.0
4          1 2018-02-01         -1       1      False    3.0
5          1 2018-03-01         -1       0      False    3.0
Performance
性能
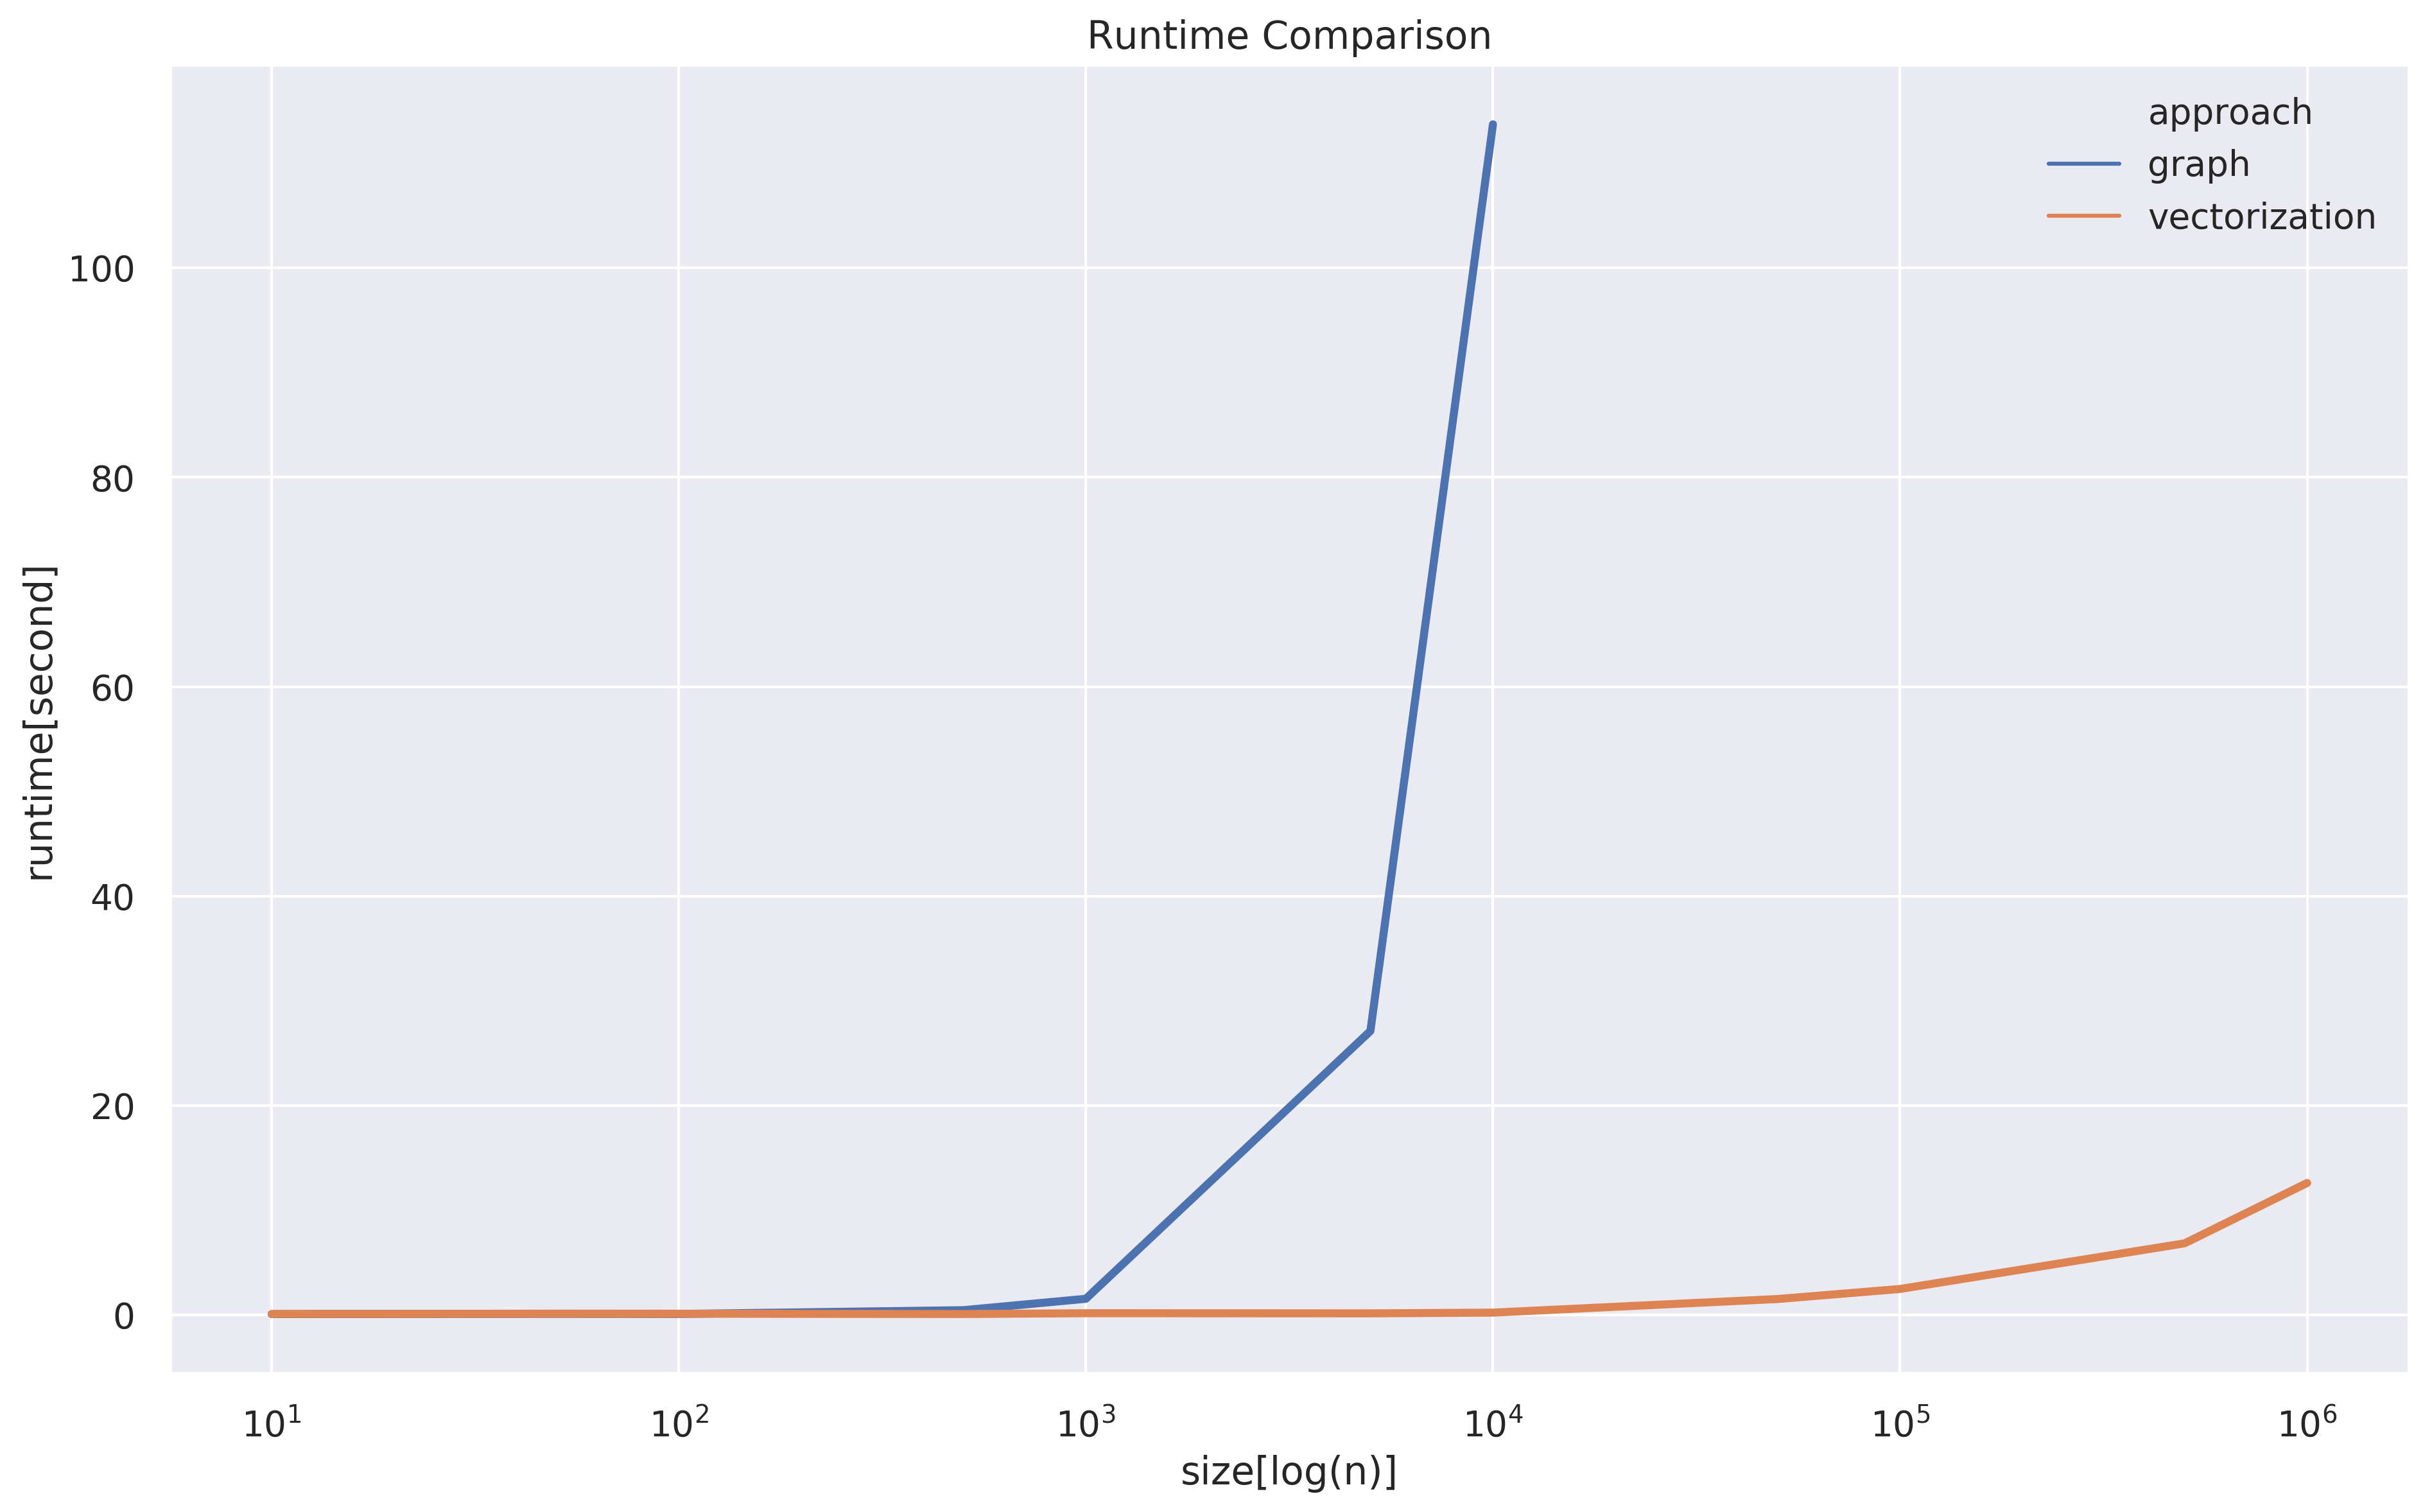
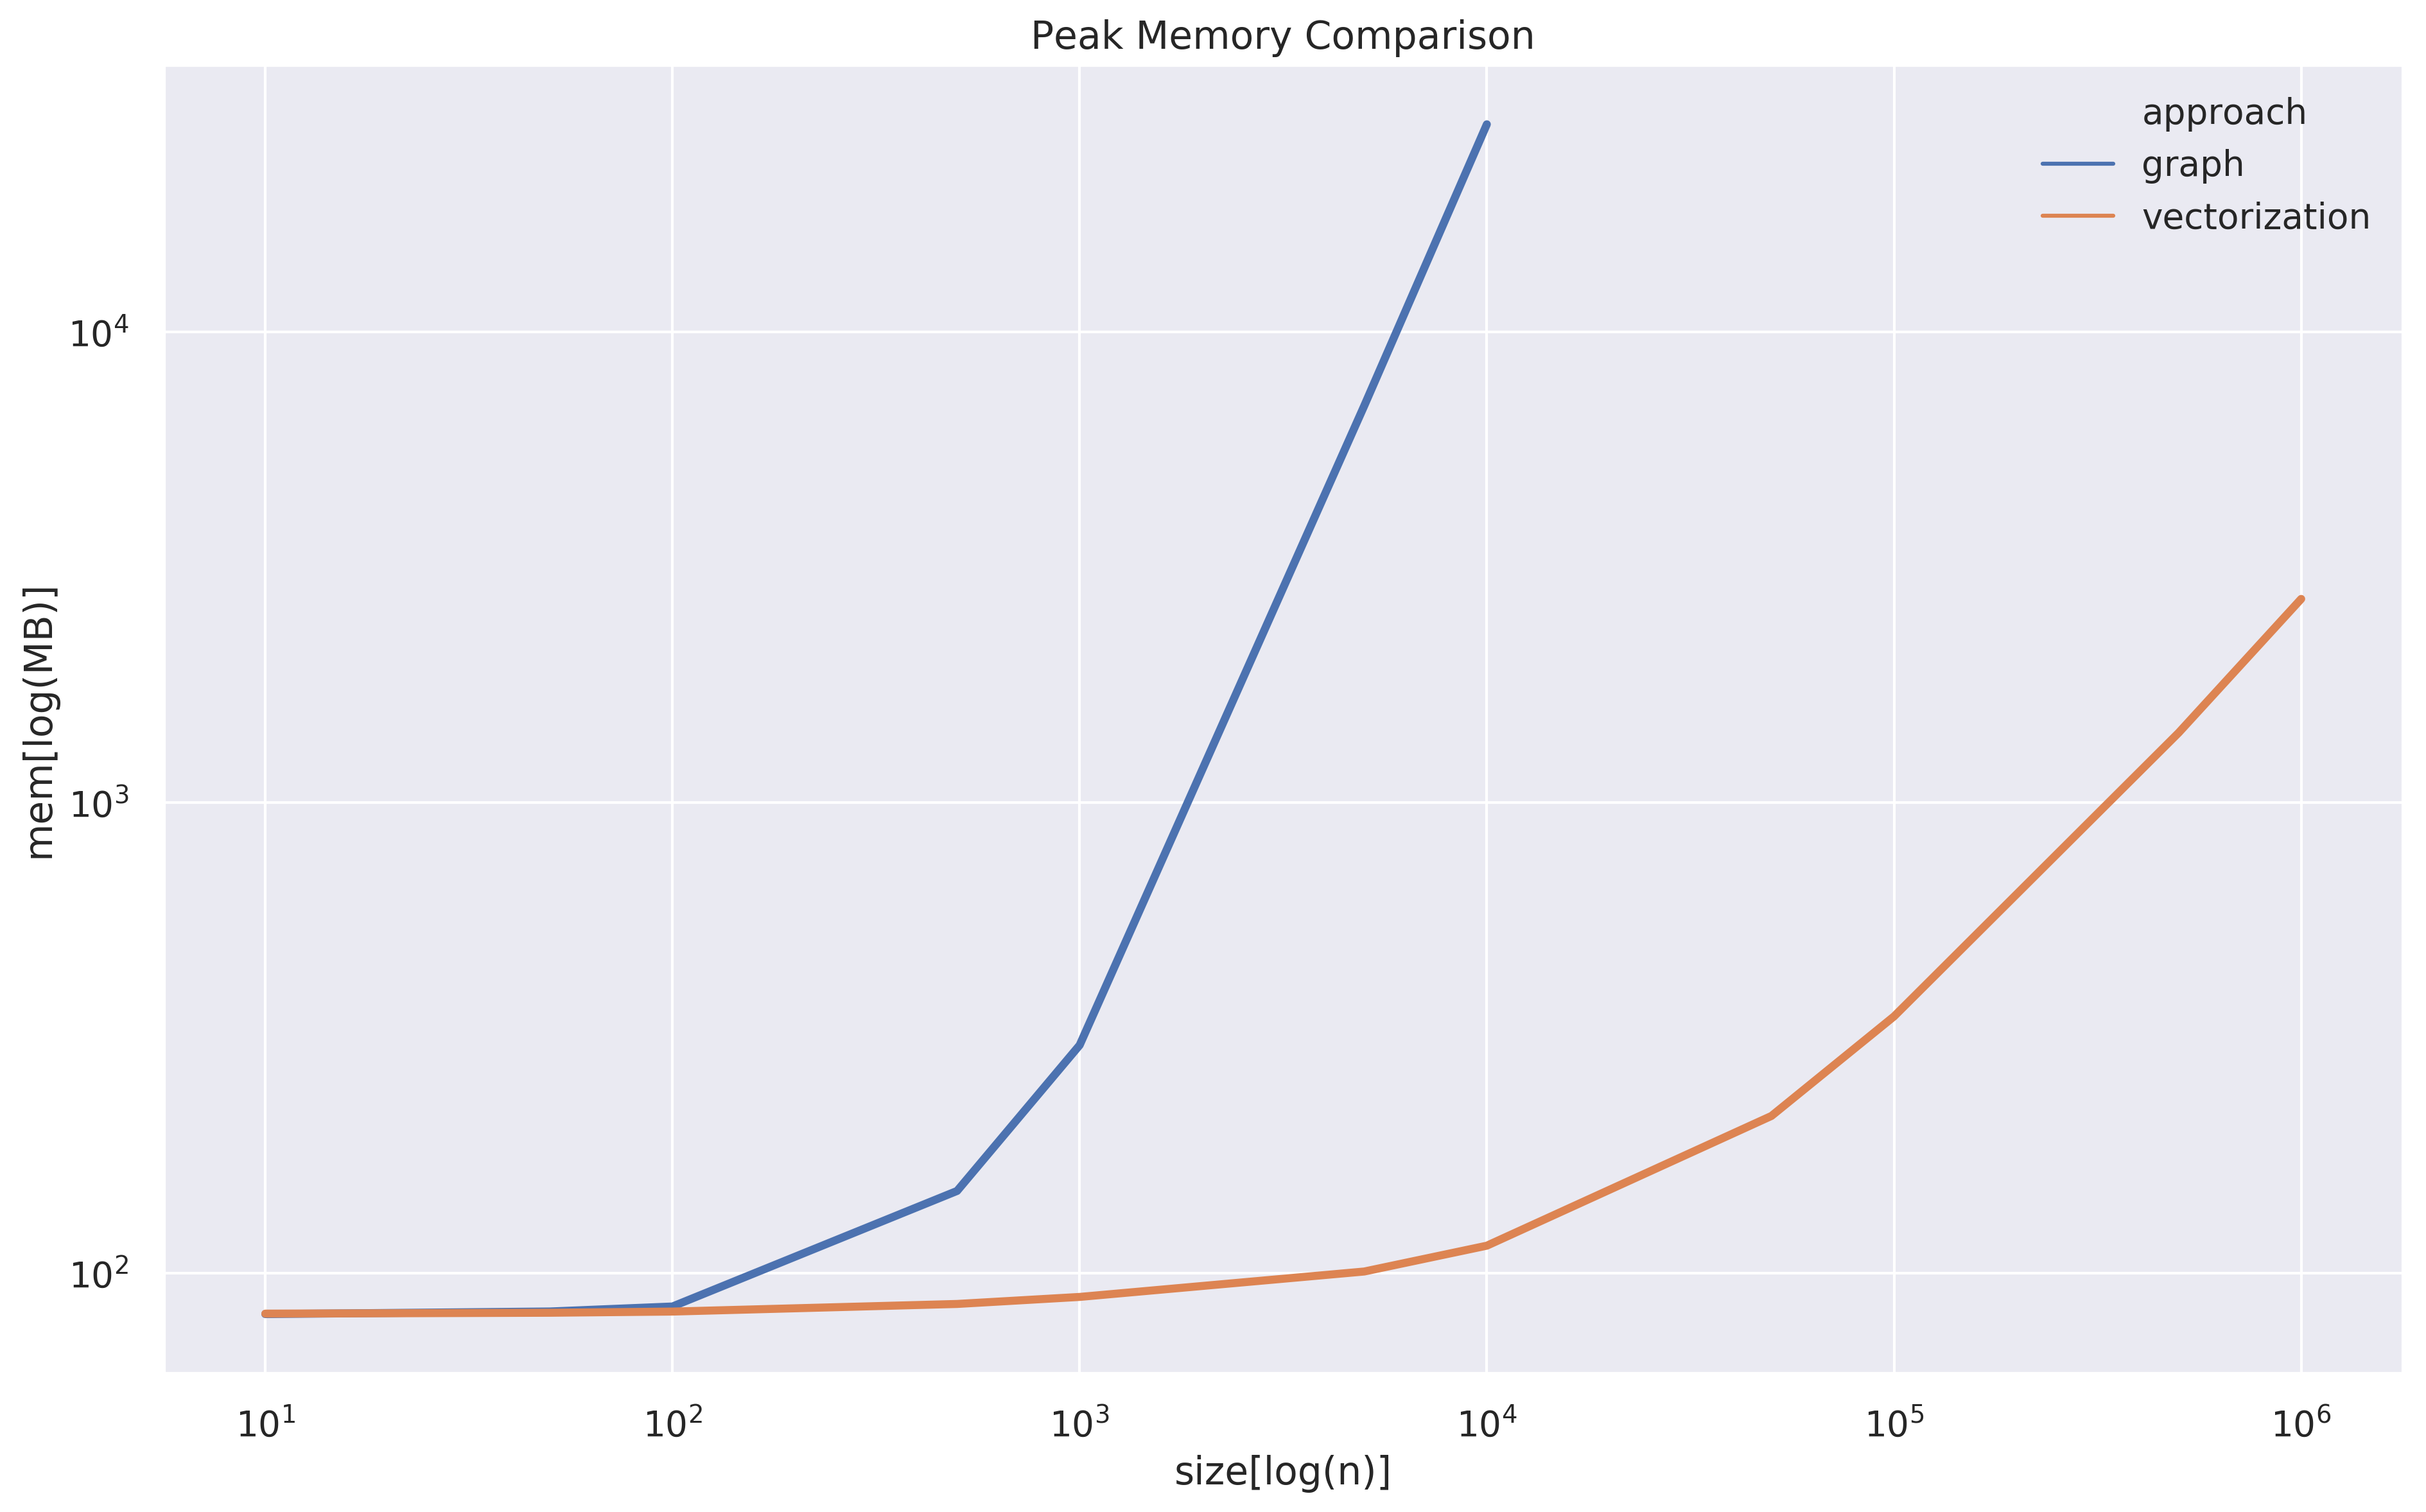
Since I don’t want to go too deep into the implementation of scipy’s connected_component and analyze its complexity, I simply wanna compare the scalability with an empirical way. What I did is just to duplicate the example n times to create a big event table and measure the runtime and peak memory with n growing in the orders of magnitude.
由于我不想太深入地研究scipy的connected_component的实现并分析其复杂性,因此我只想通过经验方法比较可伸缩性。 我所做的只是将示例重复n次以创建一个大事件表,并以n个数量级的增长来衡量运行时间和峰值内存。
Both approaches are kinda similar in runtime and memory before n hits 10². After that, it’s pretty clear that the graph approach explodes in both runtime and memory very soon. I actually ran into memory leakage when running graph approach with n=100000 on a machine with 200GB RAM. There definitely are some ways to optimize the graph approach which I’d love to see, but what I’m trying to make points here is that the operation behind scipy’s connected_componentmore memory-intense than the vectorization in pandas. I guess sometimes ugly algorithms might just beat beautiful algorithms.
在n达到10²之前,这两种方法在运行时和内存上都差不多。 在那之后,很明显,图形方法很快就会在运行时和内存中爆炸。 当在具有200GB RAM的计算机上运行n=100000图形方法时,我实际上遇到了内存泄漏。 我肯定会看到一些优化图方法的方法,但是我想在这里指出的是,scipy的connected_component背后的操作比大熊猫中的矢量化更具有存储强度。 我猜有时候丑陋的算法可能会击败漂亮的算法。
       size    mem     runtime       approach
0        10     82    0.083125          graph
1        50     83    0.111390          graph
2       100     85    0.094990          graph
3       500    150    0.458318          graph
4      1000    305    1.544724          graph
5      5000   6964   27.119864          graph
6     10000  27576  113.710234          graph
7    100000    inf         inf          graph
8        10     82    0.092768  vectorization
9        50     83    0.125092  vectorization
10      100     83    0.121607  vectorization
11      500     86    0.091670  vectorization
12     1000     89    0.168066  vectorization
13     5000    101    0.154213  vectorization
14    10000    115    0.224327  vectorization
15    50000    216    1.523057  vectorization
16   100000    351    2.482687  vectorization
17   500000   1407    6.840897  vectorization
18  1000000   2707   12.607009  vectorization
翻译自: https://medium.com/@tweddielin/overlapping-time-period-problem-b7f1719347db
根据时间段生成重叠时间


 138
138

 被折叠的 条评论
为什么被折叠?
被折叠的 条评论
为什么被折叠?
 到【灌水乐园】发言


