


替代span中的文本
Adding informative alternative text (alt text) to images is a fundamental principle of web accessibility. Currently Shiny does not have an option to add alt text to a dynamic plot created with the renderPlot() function. This article demonstrates a method of achieving this.
向图像添加内容丰富的替代文本(替代文本)是Web可访问性的基本原理。 当前,Shiny尚无选择,可将alt文本添加到使用renderPlot()函数创建的动态图上。 本文演示了一种实现此目的的方法。
常见问题 (A Common Problem)
Having discovered that there was no equivalent of the renderImage() alt parameter for renderPlot() I started searching for solutions and found a thread on this subject in the RStudio Shiny repo on GitHub. Within this thread a solution is referred to by leonawicz using observers to add alt text to dynamic plots using their id, in the absence of a feature being implemented within Shiny. The following is my solution based on this principle.
发现没有等效的renderImage() 替代项 renderPlot()参数我开始寻找解决方案,并在GitHub上的RStudio Shiny存储库中找到与此主题相关的线程 。 在此线程中, leonawicz使用观察者引用一种解决方案,以观察者使用其id将alt文本添加到动态图中,而Shiny中没有实现功能。 以下是我基于此原理的解决方案。
示例应用 (Example app)
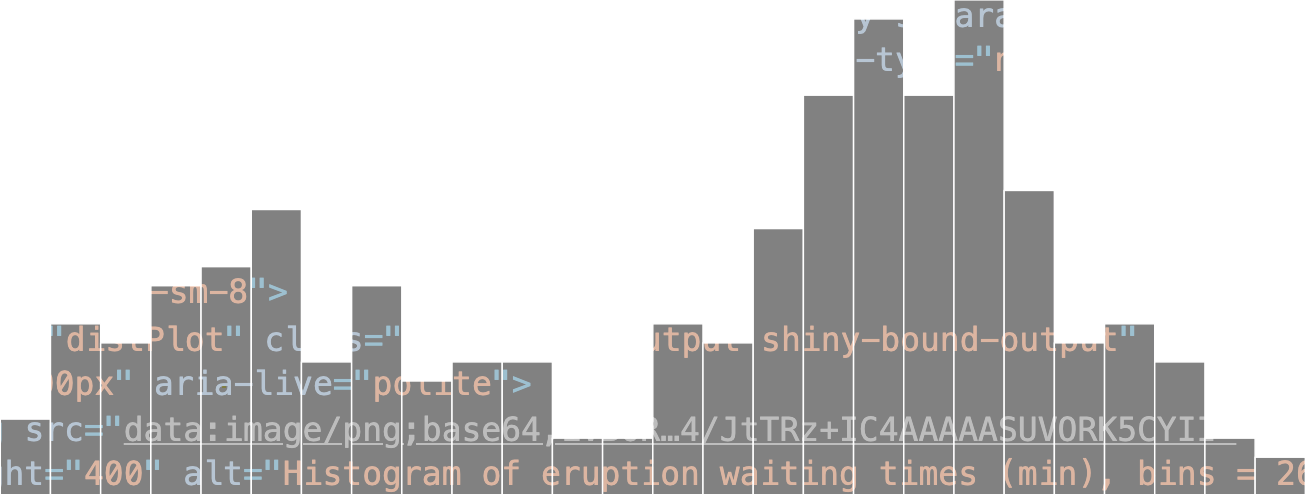
This example is based on the default histogram of Old Faithful Geyser data app created in RStudio when you use File > New File > Shiny Web App… to create a new Shiny app. I’ve made some other alterations to further improve accessibility, besides those relating to the alt text, which I’ll cover at the end of the article.
本示例基于当您使用文件>新建文件>闪亮Web应用程序…创建新的闪亮应用程序时,在RStudio中创建的旧忠实间歇泉数据应用程序的默认直方图。 除了与alt文本相关的内容(我将在本文结尾处介绍)以外,我还进行了其他一些更改以进一步改善可访问性。
#
# Based on RStudio example Shiny web application.
# Find out more about building applications with Shiny here:
#
#    http://shiny.rstudio.com/
#library(shiny)# Define UI for application that draws a histogram
ui <- fluidPage(title = "Adding dynamic alt text to plots",
  # Set the language of the page - important for accessibility
  tags$html(lang = "en"),  # CSS to improve contrast and size of slider widget numbers.
  # Placed in the <head> tag for HTML conformity
  tags$head(
    tags$style("
      /* slider scale, start and end numbers */
      .irs-grid-text, .irs-min, .irs-max {
        color: #333;
        font-size: 0.8em;
      }      /* value of slider appearing above the 'thumb' control */
      .irs-from, .irs-to, .irs-single {
        background-color: #333;
      }
    ")
  ),  # Application title
  h1("Old Faithful Geyser Data"),  # Set up the main landmark for the page - important for
  # accessibility
  HTML("<main>"),  # Sidebar with a slider input for number of bins
  sidebarLayout(
    sidebarPanel(
      sliderInput("bins",
                  "Number of bins:",
                  min = 1,
                  max = 50,
                  value = 30)
    ),    # Show a plot of the generated distribution
    mainPanel(
      plotOutput("distPlot")
    )
  ),  # End the main landmark and insert the script to add the alt text
  # to the plot image
  HTML("</main>
        <script>
          // Receive call from Shiny server with the alt text for
          // the dynamic plot <img>.
          Shiny.addCustomMessageHandler('altTextHandler', function(altText) {            // Setup a call to the update function every 500
            // milliseconds in case the plot does not exist yet
            var altTextCallback = setInterval(function() {              try {
                // Get reference to <div> containing the plot as the
                // <img> element does not have an id itself
                var plotContainer = document.getElementById('distPlot');                // Add the alt attribute to the plot <img>
                plotContainer.firstChild.setAttribute('alt', altText);                // Cancel the callback as we have updated the alt
                // text
                clearInterval(altTextCallback);
              }
              catch(e) {
                // An error occurred, likely the <img> hasn't been
                // created yet. Function will run again in 500ms
              }            }, 500);          });
        </script>
  ")
)# Define server logic required to draw a histogram
server <- function(input, output, session) {  # create a title for the plot which can also serve as the
  # beginning of the alt text
  plotTitle <- "Histogram of eruption waiting times (min)"  output$distPlot <- renderPlot({
    # extract the eruption waiting times from the dataset and
    # generate bins based on input$bins from ui.R
    x    <- faithful[, 2]
    bins <- seq(min(x), max(x), length.out = input$bins + 1)    # draw the histogram with the specified number of bins
    hist(x, breaks = bins, col = 'darkgray', border = 'white', main = plotTitle, xlab = "Eruption waiting time (min)", ylab = "Frequency of eruptions")
  })  observe({
    session$sendCustomMessage("altTextHandler", paste0(plotTitle, ", bins = ", input$bins, "."))
  })
}# Run the application
shinyApp(ui = ui, server = server)
The 2 main differences between this and the default Shiny app example which are required to achieve the updating of the alt text are:
此和默认的Shiny应用程序示例之间的2个主要区别是实现alt文本的更新所需:
the
observe()in the server object服务器对象中的
observe()the
Shiny.addCustomMessageHandler()event handler script in the ui objectui对象中的
Shiny.addCustomMessageHandler()事件处理程序脚本
观察者 (The observer)
As with the “default” RStudio app, changes to the number of bins by the user via the slider widget results in renderPlot() being re-evaluated and the plot redrawn. The role of the observer is to also communicate this change outside of the R server code:
与“默认” RStudio应用程序一样,用户通过滑块小部件更改箱数会导致对renderPlot()进行重新评估,并重新绘制绘图。 观察者的作用是也在R服务器代码之外传达此更改:
observe({
  session$sendCustomMessage("altTextHandler", paste0(plotTitle, ", bins = ", input$bins, "."))
})
Here we create the string of text to use as the alt text for the plot, taking the static title of the plot and adding to it the number of bins taken from the slider value. (This also demonstrates how the alt text can be dynamic so that it can meaningfully convey what the plot is showing.) The text is then passed to altTextHandler, an event handler declared in the script block whose job is to “listen” out for the call from the observer.
在这里,我们创建文本字符串以用作情节的替代文本,获取情节的静态标题,并向其添加从滑块值中获取的垃圾箱数量。 (这还演示了alt文本如何动态化,从而可以有意义地传达绘图显示的内容。)然后将文本传递到altTextHandler ,该事件处理程序在脚本块中声明,其任务是“侦听”该脚本。来自观察者的电话。
事件处理程序 (The event handler)
// Receive call from Shiny server with the alt text for
// the dynamic plot <img>.
Shiny.addCustomMessageHandler('altTextHandler', function(altText) {  // Setup a call to the update function every 500
  // milliseconds in case the plot does not exist yet
  var altTextCallback = setInterval(function() {    try {
      // Get reference to <div> containing the plot as the
      // <img> element does not have an id itself
      var plotContainer = document.getElementById('distPlot');      // Add the alt attribute to the plot <img>
      plotContainer.firstChild.setAttribute('alt', altText);      // Cancel the callback as we have updated the alt
      // text
      clearInterval(altTextCallback);
    }
    catch(e) {
      // An error occurred, likely the <img> hasn't been
      // created yet. Function will run again in 500ms
    }  }, 500);});
When the observer calls the event handler, the string we created to use as the alt text is passed to it as the parameter altText, ready to be used within the function. From here you might expect to be able to simply add it to the plot but there is one further issue to overcome. When Shiny calls the event handler to communicate the change, the plot hasn’t actually been redrawn yet. In fact it doesn’t actually update on the web page until after the event handler function has been executed, meaning that any changes made to the plot are essentially overwritten once we return. To counter this we use javascript’s Window setInterval() method to essentially decouple the changes we want to perform on the plot from the current flow of events.
当观察者调用事件处理程序时,我们创建的用作替代文本的字符串将作为参数altText传递给它,准备在函数中使用。 从这里开始,您可能希望能够将其简单地添加到绘图中,但是还有一个要解决的问题。 当Shiny调用事件处理程序以传达更改时,该图实际上尚未重绘。 实际上,只有在执行事件处理程序函数之后,它才真正在网页上更新,这意味着一旦返回,对该图所做的任何更改实际上都会被覆盖。 为了解决这个问题,我们使用javascript的Window setInterval() 方法从当前事件流中解耦了我们想要对绘图执行的更改。
The setInterval method will run the code inside function() { … } every 500 milliseconds until it is told to stop. The reason for this repetition is to allow Shiny to remove the current plot from the page and to replace it with the new one based on the changed values — otherwise we might be trying to add alt text to something which no longer exists, causing an error! The try { … } catch(e) { } code handles this eventuality; try to add the alt text to the plot, but if it doesn’t exist, don’t worry and try again in another 500 milliseconds. Once the new plot exists on the page we can finally add the alt text.
setInterval方法将每500毫秒运行一次function() { … }内部的代码,直到被告知停止为止。 进行此重复的原因是允许Shiny从页面上删除当前图并根据更改后的值将其替换为新图-否则,我们可能试图将alt文本添加到不再存在的内容中,从而导致错误! try { … } catch(e) { }代码可以处理这种情况; 尝试将替代文本添加到绘图中,但是如果不存在该替代文本,请不要担心,请在另外500毫秒内重试。 一旦页面上存在新图,我们最终可以添加alt文本。
In order to access the <img> element representing the plot we need some way to reference it. Unfortunately there are no unique identifiers present. Instead we have to do it via its parent element, a <div> containing the id you passed to the plotOutput() function in the ui.R code. In this example it is “distPlot”:
为了访问表示图的<img>元素,我们需要某种方式来引用它。 不幸的是,没有唯一的标识符存在。 相反,我们必须通过其父元素(包含您传递给ui.R代码中plotOutput()函数的id的<div> plotOutput()来完成此操作 。 在此示例中为“ distPlot”:
var plotContainer = document.getElementById('distPlot');The plot is the first element within the <div>, so the following references the <img> element representing the plot and adds the alt text to it using the alt attribute:
图是<div>的第一个元素,因此以下引用表示图的<img>元素,并使用alt属性向其添加alt文本:
plotContainer.firstChild.setAttribute('alt', altText);So long as we haven’t encountered any issues by this point, the final line cancels any further calls to this function:
只要到目前为止我们还没有遇到任何问题,最后一行就会取消对该函数的任何进一步调用:
clearInterval(altTextCallback);If you inspect the elements using the developer tools within your browser (Tools > Web Developer > Inspector for Firefox, View > Developer > Inspect elements for Chrome and Develop > Show Web Inspector for Safari) you will see the alt text being added after the plot changes, following a slight delay.
如果您使用浏览器中的开发人员工具检查元素(“ 工具”>“ Web开发者”> Firefox的Inspector ,“ 视图”>“开发人员”>“检查 Chrome和Develop的 元素 ” >“显示 Safari的显示Web检查器”),则会在绘图后看到添加的替代文本稍有延迟之后进行更改。
进一步改进 (Further Improvements)
Users with visual impairments may not be able to see the plot updating when the input values change, so by declaring the plot container as a dynamic region, i.e. the contents can change, screen readers can announce the alt text each time the plot changes. We do by adding an aria-live attribute to the plot container in our event handler code:
当输入值更改时,有视觉障碍的用户可能看不到图的更新,因此通过将图容器声明为动态区域,即内容可以更改,屏幕阅读器可以在每次图更改时宣布替代文本。 我们通过在事件处理程序代码中向绘图容器添加aria-live属性来实现:
try {
  // Get reference to <div> containing the plot as the
  // <img> element does not have an id itself
  var plotContainer = document.getElementById('distPlot');  // Screen readers can announce the alt text when plot updates
  if (plotContainer['aria-live'] === undefined) plotContainer.setAttribute('aria-live', 'polite');  // Add the alt attribute to the plot <img>
  plotContainer.firstChild.setAttribute('alt', altText);  // Cancel the callback as we have updated the alt
  // text
  clearInterval(altTextCallback);
}
catch(e) {
  // An error occurred, likely the <img> hasn't been
  // created yet. Function will run again in 500ms
}
This only needs to be done once, so we check first to see if the aria-live attribute exists and then add it if not. The value 'polite’ simply means that the announcement of the alt text will be delayed until the screen reader has finished reading out any other information, to prevent interruption.
这仅需要执行一次,因此我们首先检查aria-live属性是否存在,然后将其添加。 值'polite'仅表示在屏幕阅读器完成读取任何其他信息之前,将延迟显示替代文本,以防止中断。
Other accessibility improvements I added to the example are:
我添加到示例中的其他可访问性改进包括:
Setting the language of the page
tags$html(lang = “en”)so that the content can be better understood by software, including screen readers.设置页面
tags$html(lang = “en”)的语言,以便软件(包括屏幕阅读器)可以更好地理解内容。Identifying the main content of the page using a landmark element
HTML(“<main>”)to assist navigation.使用界标元素
HTML(“<main>”)识别页面的主要内容,以辅助导航。- Using CSS to improve the contrast and size of the numbers used on the slider widget: 使用CSS改善滑块小部件上使用的数字的对比度和大小:
tags$head(
  tags$style("
    /* slider scale, start and end numbers */
    .irs-grid-text, .irs-min, .irs-max {
      color: #333;
      font-size: 0.8em;
    }    /* value of slider appearing above the 'thumb' control */
    .irs-from, .irs-to, .irs-single {
      background-color: #333;
    }
  ")
),
Hopefully these techniques will help improve the accessibility of your Shiny apps, and any other web content you produce.
希望这些技术将有助于改善Shiny应用程序以及您生成的任何其他Web内容的可访问性。
建议进一步阅读 (Suggested Further Reading)
“Alternative Text”, WebAIM
WebAIM“ 替代文本 ”
“How to understand reactivity in R”, RStudio
“ 如何理解R中的React性 ”,RStudio
“Communicating with Shiny via JavaScript”, RStudio
“ 通过JavaScript与Shiny进行通信 ”,RStudio
翻译自: https://medium.com/@traffordDataLab/alt-text-for-dynamic-plots-in-shiny-2e24c684f187
替代span中的文本


 555
555

 被折叠的 条评论
为什么被折叠?
被折叠的 条评论
为什么被折叠?
 到【灌水乐园】发言


