


统计学习 机器学习
When it comes to statistics in machine learning, a common approach to accept or reject a null hypothesis is to check for the p-values and give a result without really having an idea of what goes on in the background. Without getting into any kind of fancy jargons or mathematical technicalities, this article attempts to sum up the intuition behind statistics using some real life examples especially for people from a non-statistics background.
当涉及到机器学习中的统计时,接受或拒绝原假设的一种常见方法是检查p值并给出结果,而无需真正了解后台发生了什么。 在不涉及任何花哨的行话或数学技巧的情况下,本文尝试使用一些现实生活中的例子来总结统计背后的直觉,尤其是对于那些来自非统计学背景的人。
Why do we need hypothesis testing?
为什么我们需要假设检验?
We all love donuts. But what if suddenly, Dunkin’ happens to shut down because Krispe Kreme claims the weight of their donuts is less than what Dunkin’ claims. How do we choose sides? How do we decide what amount of less is too less? In situations like these, what we try to analyze is if the weight difference between the samples is statistically significant or is it a minor difference due to human or machine error.
我们都喜欢甜甜圈。 但是,如果突然之间,Dunkin'突然倒闭了,因为Krispe Kreme声称他们的甜甜圈的重量小于Dunkin'的声称。 我们如何选择边? 我们如何确定少多少少呢? 在这种情况下,我们尝试分析的是样本之间的重量差异是否在统计上显着,还是由于人为或机器错误而造成的微小差异。
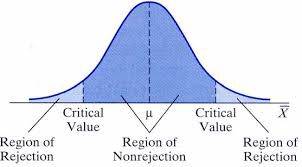
Our main aim of any statistical test therefore, is to define the values for the significance level, commonly known as the critical values, which give us a threshold to decide if we need to reject or accept our null hypothesis. In the figure, μ is the average weight that Dunkin’ claims, all the weights that lie within the dark blue region are statistically insignificant. But if the average weight of collected samples lies in the light blue region, we say the weight difference is statistically significant, and hence, the claim made against Dunkin’ was true.
因此,任何统计检验的主要目的是定义显着性水平的值,通常称为临界值,这为我们确定是否需要拒绝或接受原假设的阈值。 在图中,μ是Dunkin声称的平均重量,位于深蓝色区域内的所有重量在统计上都不重要。 但是,如果收集的样本的平均重量在浅蓝色区域,则我们说重量差异在统计上是显着的,因此,针对Dunkin'的主张是正确的。
Different types of statistical tests
不同类型的统计检验
t-test : We have 2 samples, with heights of boys and heights of girls, and we want to see if they have similar heights. Perform a t-test, compare means and see if the acceptance region for both coincides, and Bingo!
t检验:我们有2个样本,男孩的身高和女孩的身高,我们想看看它们的身高是否相似。 执行t检验,比较均值,看看两者的接受区域是否一致,然后进行Bingo!

Z-test and t-test are often confused at times, since both are used to compare numerical features. The difference is, we are given the population standard deviation in a z-test, and we use sample standard deviation in a t-test, but the underlying idea for comparison stays the same.
Z检验和t检验有时有时会混淆,因为两者都用于比较数值特征。 不同之处在于,我们在z检验中获得了总体标准差,而在t检验中使用了样本标准差,但是用于比较的基本思想保持不变。
2. ANOVA : Let’s say we have 3 gyms, and we want to decide if there is a significant difference in their performance based on the weights of their customers. Again, we take an average of the 3 groups and compare the mean weights.
2.方差分析:假设我们有3个体育馆,我们想根据客户的体重来决定他们的表现是否存在显着差异。 同样,我们取3组的平均值并比较平均权重。

How is it different from a t-test, we might wonder, because from what we know, ANOVA is used to compare a categorical column with a numerical column and see if there is any kind of relationship between them.
我们可能想知道,它与t检验有何不同,因为据我们所知,ANOVA用于比较分类列和数值列,并查看它们之间是否存在任何类型的关系。
For the same case, say you have a categorical column that has 3 unique values for the gym : Gym1, Gym2, Gym3, and you have another column with the weights of people in these gyms. On the surface, we are comparing a numerical and categorical column, but on the inside, what it really does is simply comparing means of the weight for people of 3 gyms separately. That is, if there is an overlap of their acceptance regions for weights, it means there is no significant difference between the 3 gyms, and hence no relationship between the 2 columns.
对于相同的情况,假设您有一个类别列,其中包含3个健身房的唯一值:Gym1,Gym2,Gym3,并且您还有另一个列包含这些健身房中的体重。 表面上,我们正在比较数字和分类列,但在内部,它真正要做的只是简单地分别比较3个体育馆的人的体重平均值。 也就是说,如果它们的重量接受区域重叠,则意味着3个体育馆之间没有显着差异,因此2列之间没有关系。
3. Chi-Square : We use chi-square to compare categorical variables. So, instead of comparing means, we compare the value counts for different variables in a Chi-square test. We take the expected value counts for every categorical combination and compare it with the observed value counts.
3.卡方:我们使用卡方来比较分类变量。 因此,我们在卡方检验中比较了不同变量的值计数,而不是比较均值。 我们对每个分类组合取期望值计数,并将其与观察值计数进行比较。
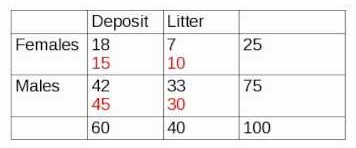
Difference in the number of observed and expected values ideally should be 0. But the difference in values that would be statistically significant is determined using graph for the specified degrees of freedom and the chi-square table. But, let’s not get into that part for now.
理想值与观测值的数量差应为0。但是,对于指定的自由度和卡方表,使用图形确定具有统计学意义的值的差。 但是,我们暂时不讨论这一部分。
To sum up, when we say the p-value is less than α(0.05), we mean the overlapping of acceptance regions of variables is less than 5%, so it is statistically significant. While performing any statistical test , what we essentially need to remember is that we are always analyzing column relationships by comparing the acceptance region of their means, irrespective of the kind of data we are dealing with or the kind of test we perform.
综上所述,当我们说p值小于α(0.05)时,意味着变量的接受区域的重叠小于5%,因此具有统计学意义。 在执行任何统计测试时,我们本质上需要记住的是,我们总是通过比较列均值的接受区域来分析列关系,而不管我们正在处理的数据类型还是执行的测试类型。
Hope that helps!
希望有帮助!
翻译自: https://medium.com/@geetikasingla11/statistical-tests-in-machine-learning-e6c74fb5b872
统计学习 机器学习


 1万+
1万+


 被折叠的 条评论
为什么被折叠?
被折叠的 条评论
为什么被折叠?
 到【灌水乐园】发言


