


硬件开发和软件开发哪个更难
Do some types of software development yield greater satisfaction? Analysis of Stack Overflow’s 2020 developer survey data.
某些类型的软件开发是否会带来更大的满足感? 分析Stack Overflow的2020年开发人员调查数据。
As computing has come to be applied to seemingly every imaginable area of human life, the software development process has naturally become specialized. If you are planning to begin a career in coding, considering future career moves, or just wondering whether the grass is greener on the other side, you might wonder if there are systematic differences in job satisfaction of those who work in the different specializations. Do coders, on average, find more satisfaction in some roles than others?
随着计算似乎已经应用于人类生活中每个可以想象的领域,软件开发过程自然已经变得专门化。 如果您打算开始从事编码工作,考虑将来的职业发展,或者只是想知道另一边的草是否更绿,您可能会想知道,从事不同专业的人的工作满意度是否存在系统性差异。 平均而言,编码人员是否对某些角色感到满意?
The Stack Overflow Developer Survey is described by its creators as “the largest and most comprehensive survey of software developers (and anyone else who codes!) on Earth.” Let’s take a look at the 2020 survey data and see whether it reveals anything significant about job satisfaction among different coding roles (referred to as “developer types” in the survey.)
堆栈溢出开发者调查被其创建者描述为“地球上最大,最全面的软件开发者(以及任何其他编码!)调查”。 让我们看一下2020年的调查数据,看看它是否揭示了有关不同编码角色(在调查中称为“开发人员类型”)之间的工作满意度的重要信息。
工作满意度可预测吗? (Is Job Satisfaction Predictable?)
There are of course many elements that contribute to job satisfaction, and it seems likely that major contributors to variations in satisfaction would include subjective factors such as personal attitudes and the nature of relationships in one’s work group. The Stack Overflow survey questions almost exclusively address objective factors of the respondent’s background and current job, including the factor of interest here, the type of development that they are doing.
当然,有许多因素可以促进工作满意度,而导致满意度变化的主要因素似乎包括主观因素,例如个人态度和工作组中人际关系的性质。 堆栈溢出调查问题几乎专门针对受访者的背景和当前工作的客观因素,包括此处的关注因素,他们正在从事的发展类型。
To gain a deeper understanding of the degree of contribution of objective factors to self-reported job satisfaction, I built a regression model to attempt to predict job satisfaction from a collection of surveyed factors.¹
为了更深入地了解客观因素对自我报告的工作满意度的贡献程度,我建立了回归模型,试图通过一系列调查因素来预测工作满意度。¹
The developer job satisfaction measure we attempt to predict is the respondent’s five-valued (lowest to highest) self-assessment of the question “How satisfied are you with your current job?”
我们试图预测的开发人员工作满意度衡量标准是受访者对“您对当前工作的满意度如何”问题的五值(最低到最高)自我评估。
I chose to use a gradient boosted decision tree for the regression model, in part due to the potential for assessing feature importance.
我选择对回归模型使用梯度增强决策树,部分原因是可以评估特征重要性。
模型结果 (Model Results)
As expected, we found that the available objective factors did not explain most of the variation of reported job satisfaction. Compared to the overall variation in job satisfaction, the surveyed factors available to us had a small effect. After using the majority of the data to train our model, we assessed the model’s ability to predict satisfaction on the remaining data. The coefficient of determination (or R² value) of our model was 0.04, indicating that 96% of the variance in job satisfaction remained unexplained by our model.
正如预期的那样,我们发现可用的客观因素不能解释所报告的工作满意度的大部分变化。 与工作满意度的总体差异相比,我们可获得的调查因素影响很小。 在使用大部分数据训练我们的模型之后,我们评估了该模型预测其余数据满意度的能力。 我们模型的确定系数(或R²值)为0.04,表明我们的模型无法解释96%的工作满意度差异。
调查因素重要性 (Surveyed Factor Importance)
Significant to our interest in the influence of developer type on job satisfaction is the importance of each of the survey factors to the effect they were able to explain.
显著我们在对工作满意度开发型的影响感兴趣的是每个调查的因素, 他们能够解释的影响的重要性。
The library that I used to create the regression model (CatBoost) provides a method that estimates each feature’s contribution to prediction value, expressed as a percentage of total contribution. Here is the result of that estimate:
我用来创建回归模型的库(CatBoost)提供了一种方法,用于估算每个要素对预测值的贡献,以占总贡献的百分比表示。 这是该估计的结果:
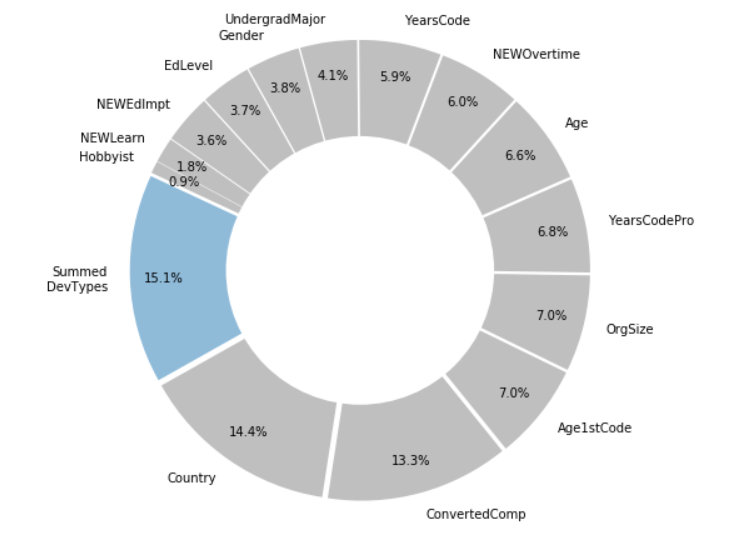
Each of the developer types were represented as a separate feature, so here I have shown the sum of the contributions from each type.
每种开发人员类型均表示为单独的功能,因此在这里,我展示了每种类型的贡献总和。
The feature importance metric shown here is not an absolute measure of importance, but it does show that developer type is a significant contributor to the effect on job satisfaction that we could predict using these survey factors.
这里显示的功能重要性度量标准不是绝对的重要性度量标准,但是它确实表明开发人员类型是我们可以使用这些调查因素预测的对工作满意度影响的重要因素。
Great! Let’s take a closer look at differences in job satisfaction among different types of developers.
大! 让我们仔细研究一下不同类型开发人员之间的工作满意度差异。
是否更满意某些开发人员类型? (Are Some Developer Types More Satisfied?)
Each respondent to the survey could select one or more developer types that described their current work. There were 21 developer types listed, including such options as “Front-End Developer”, “System Administrator”, “Data Engineer”, “Academic Researcher”, etc.²
每个接受调查的受访者都可以选择一种或多种描述其当前工作的开发商类型。 列出了21种开发人员类型,包括“前端开发人员”,“系统管理员”,“数据工程师”,“学术研究人员”等选项。²
Since many respondents selected multiple developer types, I treated each developer type for a respondent as each providing an equally weighted contribution to the respondent’s reported job satisfaction.
由于许多受访者选择了多种开发人员类型,因此我将每种开发人员类型都视为受访者,因为每种受访者对报告的工作满意度的贡献均相等。
Here are the results of computing the weighted mean job satisfaction for each of the developer types:
以下是每种开发人员类型的加权平均工作满意度的计算结果:
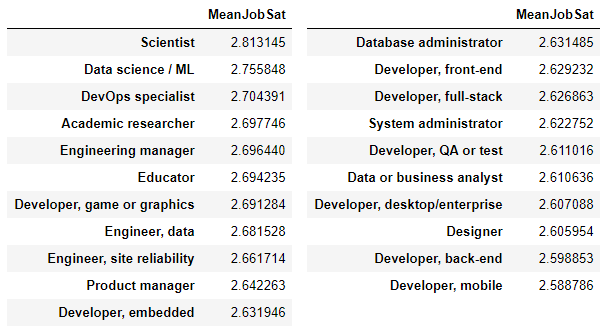
These values hew quite closely to the overall mean satisfaction of 2.632, with the highest scoring developer type 0.18 greater than the mean, and the lowest 0.043 off the mean. The big question is whether developer type truly has a significant effect on job satisfaction or the observed differences are merely artifacts of the random effects of the sampling.
这些值非常接近2.632的总体平均满意度,得分最高的显影剂类型比平均值高0.18,而比平均值低0.043。 最大的问题是,开发人员类型是否确实对工作满意度有重大影响,还是观察到的差异仅仅是抽样随机效应的产物。
平均满意度差异显着吗? (Are Differences in Mean Satisfaction Significant?)
I assessed the significance of the difference between mean satisfaction for all pairings of developer types.³ Using a significance level of 0.05 (indicating that we will consider the difference significant if there is at most a 5% probability of seeing this difference measurement or greater when there is no actual difference in satisfaction) there were both many pairs that did not have a significant difference, and many that did.
我评估了所有开发人员类型对的平均满意度之间差异的显着性。³显着性水平为0.05(表明如果差异查看的可能性最大为5%或更大,则我们将认为差异显着满意度没有实际差异)有很多对并没有显着差异,但很多对都没有。
The results are summarized in the following directed graph (digraph), where a directed edge from developer type A to developer type B indicates that the mean satisfaction of A is greater than that of B at the chosen significance level of 0.05.
结果总结在下面的有向图(有向图),其中从显影剂类型A到B型显影剂的有向边表示A的平均满意于B以0.05的选择显着性水平的更大。
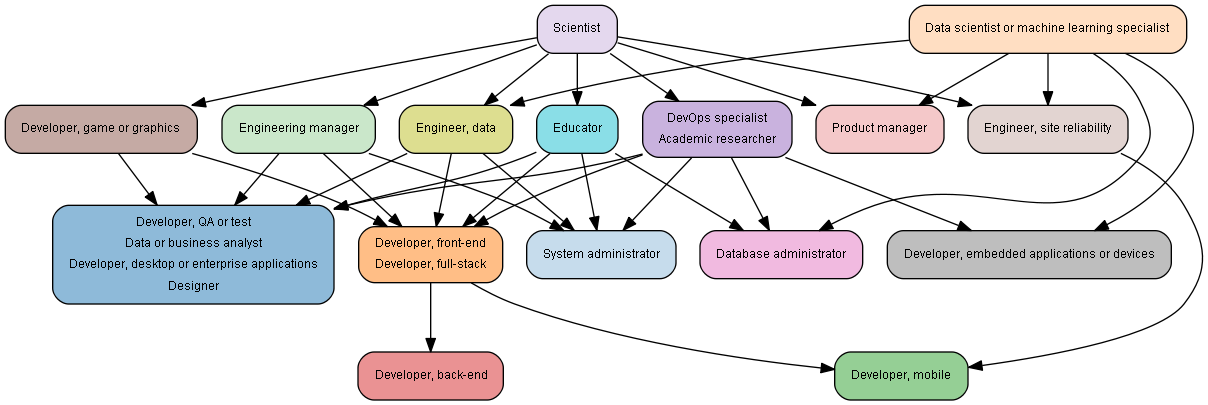
Note that some developer types can be grouped into a single node when each of these developer types have identical relationships with the other nodes in the digraph.
请注意,当每种开发者类型与有向图中的其他节点具有相同的关系时,可以将某些开发者类型分组为单个节点。
最(和最少)满足哪些开发人员类型? (What Developer Types Are Most (and Least) Satisfied?)
The following bar chart is another view of the data that helps us compare satisfaction among developer types.
以下条形图是数据的另一视图,可帮助我们比较开发人员类型之间的满意度。
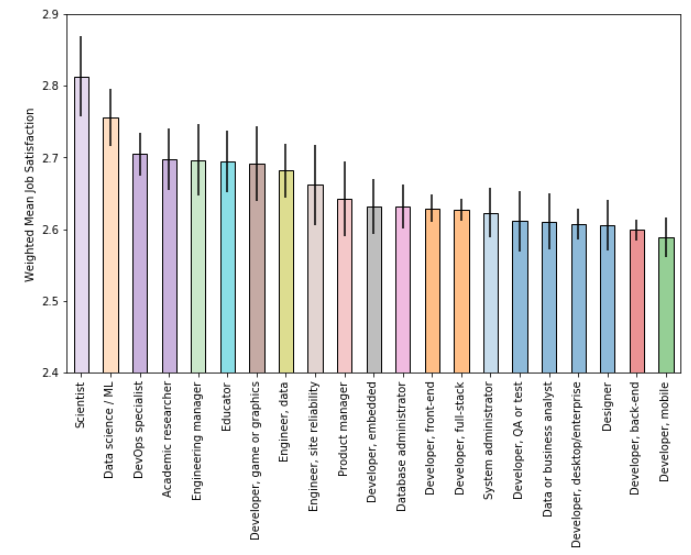
The developer types are shown in descending order of mean satisfaction score. The error bars show an 85% confidence interval for this mean satisfaction score sample statistic.
显影剂类型以平均满意度得分的降序显示。 误差线显示此平均满意度得分样本统计量的85%置信区间。
The 85% confidence interval is chosen so that non-overlapping error bars of a pair of developer types may suggest a significant difference in weighted mean between the two. To accurately assess the significance of a pair’s difference, refer to the digraph above. To assist in this, the bars are color coded to match the digraph’s nodes.
选择85%的置信区间,以便一对显影剂类型的不重叠误差线可能表明两者之间的加权平均值存在显着差异。 要准确评估一对差异的重要性,请参考上面的图。 为了帮助实现此目的,对条形进行颜色编码以匹配有向图的节点。
Eyeballing the bar chart (and paying close attention to the degree of overlap of error bars) yields an overall impression of the roles with significantly greater or lesser reported satisfaction.
盯着条形图(并密切注意误差条的重叠程度)可得出总体上对角色的印象,报告的满意度明显不同。
We can refer to the digraph for more precision about which mean differences are significant. Also, the digraph is organized into levels, with roles at the first level being those that do not have significantly lower satisfaction than any other nodes, roles at the second level having satisfaction significantly lower only than those at the first level, and so forth. We can refer to these layers to provide an overview of the effect of developer role on reported job satisfaction in this sample.
我们可以参考有向图以获得更精确的平均差值。 而且,有向图被分为多个级别,第一级别的角色的满意度不比任何其他节点低,第二级别的角色的满意度仅比第一级别的满意度低,依此类推。 我们可以参考这些图层,以概述此示例中开发人员角色对报告的工作满意度的影响。
At the top (first) level of the digraph, are two developer roles with significantly greater reported satisfaction than most of the other roles: Scientist, and Data Scientist/Machine Learning Expert.
在该图的顶层(第一层),是两个开发人员角色,他们的报告满意度比其他大多数角色要高得多 : 科学家和数据科学家/机器学习专家。
At the second level of the digraph are six developer roles with significantly greater reported satisfaction than many other roles: Academic Researcher, Data Engineer, DevOps Specialist, Educator, Engineering Manager, and Game/Graphics Developer.
在图的第二层,有六个开发人员角色,其报告的满意度比许多其他角色要高得多 : 学术研究员,数据工程师,DevOps专家,教育者,工程经理和游戏/图形开发人员。
At the fourth (bottom) level of the digraph are two developer roles with significantly lower reported satisfaction than the majority of other roles: Back-end developer, and Mobile developer.
在图的第四个(底部)级别,有两个开发人员角色的报告满意度明显低于其他大多数角色: 后端开发人员和移动开发人员。
Finally, the remaining 11 roles form the “mediocre many.” These roles have significantly lower satisfaction than many roles. Of course none of these 11 have significant differences in reported satisfaction compared to one another. They are: Data or Business Analyst, Database Administrator, Designer, Desktop/Enterprise Developer, Embedded Developer, Front-End Developer, Full-Stack Developer, Product Manager, QA or Test Developer, Site Reliability Engineer, System Administrator.
最后,剩下的11个角色构成“ 中庸 ”。 这些角色的满意度远低于许多角色。 当然,这11个报告的满意度之间没有一个显着差异。 他们是: 数据或业务分析师,数据库管理员,设计人员,桌面/企业开发人员,嵌入式开发人员,前端开发人员,全栈开发人员,产品经理,质量保证或测试开发人员,站点可靠性工程师,系统管理员。
注意图解释和视觉上比较图表 (Caution on Digraph Interpretation, and Visually Evident “Comparison Charts”)
Note that there are two nodes appearing in the second level that we didn’t include in our list of second-level roles with “greater reported satisfaction than many.” (Product Manager and Site Reliability Engineer.) This is simply because the variance of the sample distribution for these two roles is sufficiently large that only the roles with the most extreme values (Scientist and Data Scientist on the high side, and Mobile Developer on the low side) have a significant difference in job satisfaction compared to Product Manager and Site Reliability Engineer.
请注意,第二级中有两个节点未出现在第二级角色列表中,“报告的满意度比许多人高”。 ( 产品经理和站点可靠性工程师。)这仅仅是因为这两个角色的样本分布方差足够大,以至于只有具有最高价值的角色(高端的科学家和数据科学家 ,以及高端的移动开发人员)与产品经理和站点可靠性工程师相比,工作满意度方面存在显着差异。
Product Manager and Site Reliability Engineer appear at level two of the digraph because they are not significantly worse than any level two roles, not because they are superior to level three roles. It’s important to keep in mind that superiority of role A over B is only indicated if there is a directed edge from A to B.
产品经理和站点可靠性工程师之所以出现在本图的第二级,是因为它们并不比任何第二级角色都差很多,不是因为它们优于第三级角色。 重要的是要记住, 仅当从A到B有直接优势时, 才表明角色A胜过B。
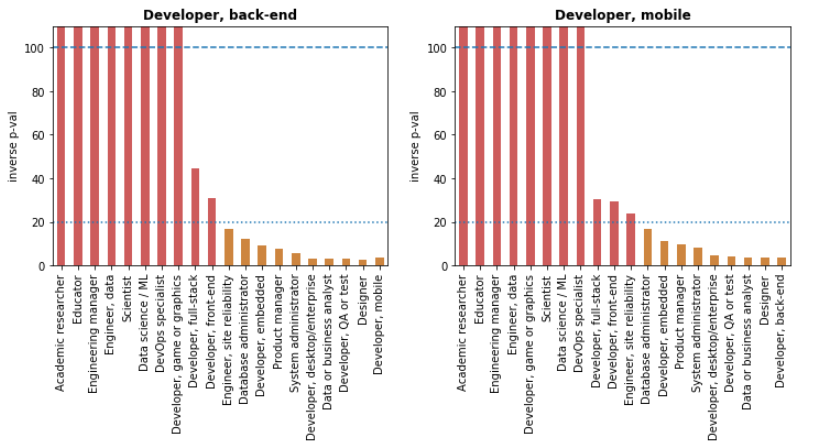
A more-detailed representation of the data makes the distinction between Product Manager and Site Reliability Engineer versus the other roles at level two of the digraph apparent. In the following two “comparison charts”, we plot the significance of the differences between Site Reliability Engineer and Product Manager, and all other developer types.
数据的更详细表示形式使产品经理和站点可靠性工程师与图的第二级其他角色之间的区别显而易见。 在以下两个“比较表”中,我们绘制了站点可靠性工程师和产品经理以及所有其他开发人员类型之间差异的重要性。
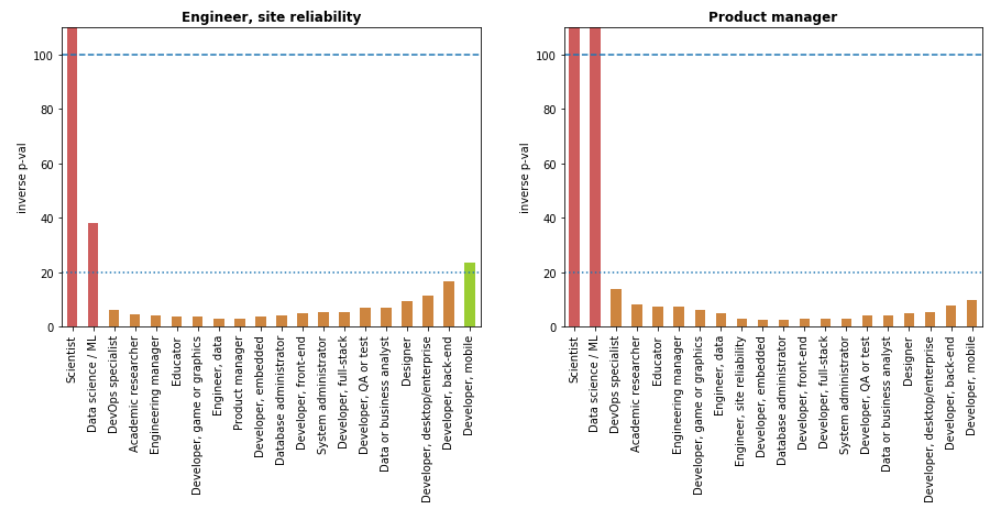
Larger bars indicate greater significance. A bar above the bottom dotted line indicates significance at the 0.05 level; above the top dashed line indicates significance at the 0.01 level. A red bar indicates that the developer type in the title has a significantly lower mean satisfaction score; green indicates significantly higher.
较大的条表示更大的意义。 底部虚线上方的横条表示显着性水平为0.05; 上方虚线上方的数字表示在0.01水平的显着性。 红色栏表示标题中的开发人员类型的平均满意度得分明显较低 ; 绿色表示明显更高 。
This representation makes it clear that Product Manager and Site Reliability Engineer are not significantly different than most, significantly worse than only the two topmost, and significantly better (in one case) only than the bottom-scoring Mobile Developer.
这种表述清楚地表明, 产品经理和站点可靠性工程师与大多数人并没有显着差异,仅比排名前两位的前者差得多,并且仅比得分最低的Mobile Developer好得多(在一种情况下) 。
Comparison charts also make it easy to see the difference between Product Manager and Site Reliability Engineer and the other roles on level two of the digraph. The other roles, in contrast, have significantly higher job satisfaction scores than many other roles:
比较图表还可以轻松查看产品经理和站点可靠性工程师之间的区别,以及该图的第二层上的其他角色。 相比之下,其他角色的工作满意度得分却明显高于其他许多角色:
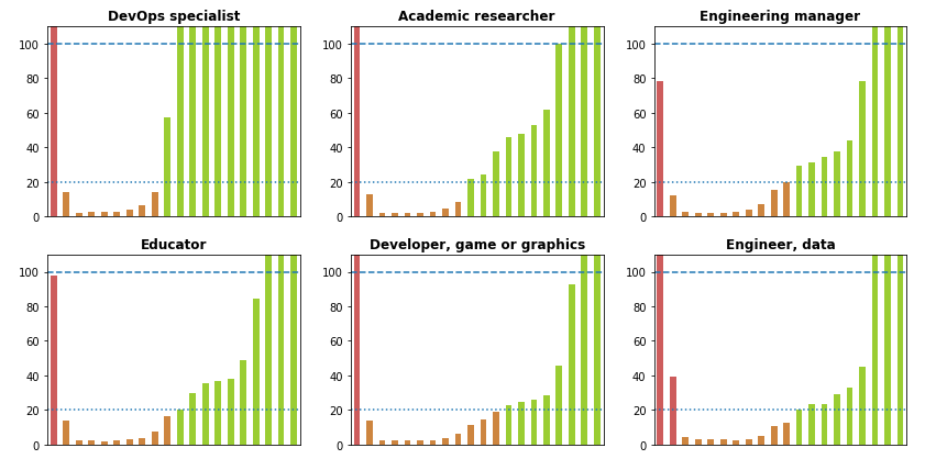
To provide a complete reporting of the results, here are comparison charts for the remaining roles.
为了提供完整的结果报告,以下是其余角色的比较表。
The two developer roles appearing in the top level of the digraph that had greater reported satisfaction than most:
在图的顶层出现的两个开发人员角色的报告的满意度高于 大多数人:
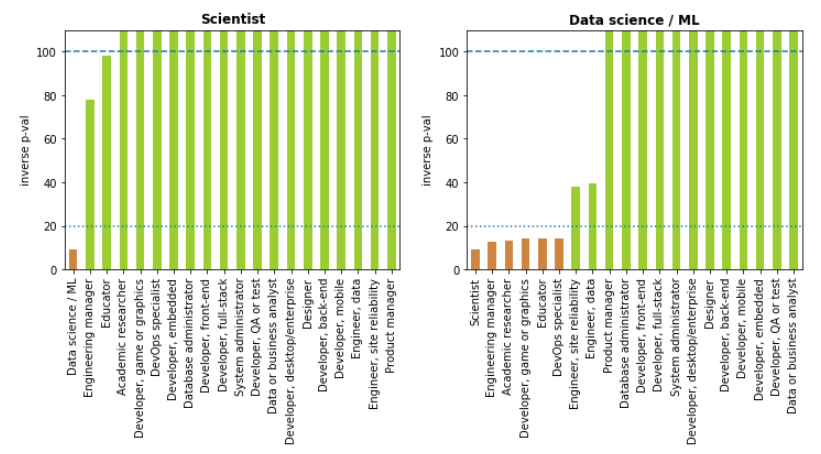
The “mediocre many:”
“中等多:”
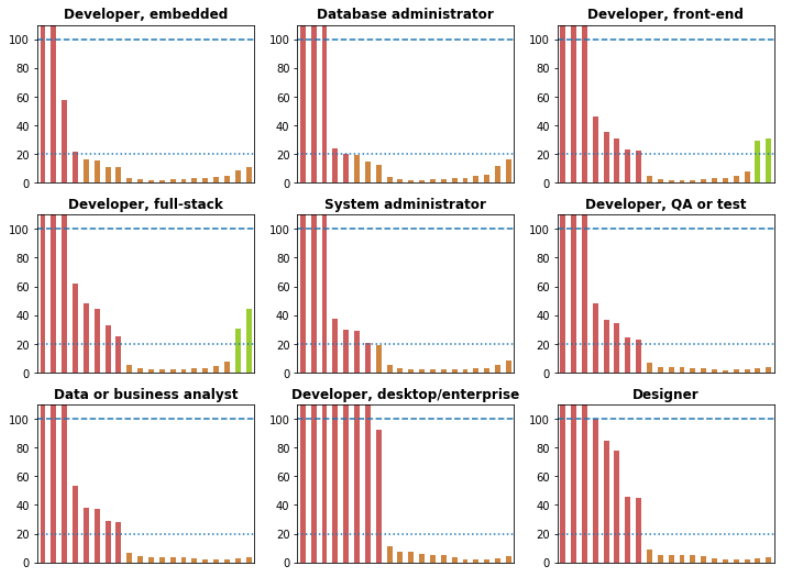
The bottom-level with significantly lower reported satisfaction than the majority:
报告满意度低于大多数的最低层:
结论 (Conclusion)
In this article, we took a look at whether coders in some job roles had greater job satisfaction.
在本文中,我们研究了某些工作角色中的编码人员是否具有更高的工作满意度。
We observed that, as expected, the objective job factors reported in the survey could only account for a small amount of the total variation in reported job satisfaction. Of the effect that was accounted for by the survey factors, developer role was one of the largest contributors.
我们观察到,正如预期的那样,在调查中报告的客观工作因素仅占报告的工作满意度总体差异的很小一部分。 这是由调查因素占的效果,开发商的作用是最大的贡献者之一。
A bit more than a third of the coding roles had mean satisfaction scores that were significantly higher than those of many other roles. This group had a bias toward roles that include significant non-coding components, such as Scientist, Educator, and Academic Researcher. This group also included some roles with a large or primary focus on writing code (Data Scientist, DevOps Specialist, Game/Graphics Developer, Data Engineer.)
三分之一以上的编码角色的平均满意度得分明显高于许多其他角色。 这个小组对角色的偏见包括科学,教育家和学术研究员等重要的非编码部分。 该小组还包括一些主要或主要致力于编写代码的角色( 数据科学家,DevOps专家,游戏/图形开发人员,数据工程师) 。
About half the roles scored significantly lower than many other roles and had very similar mean satisfaction scores. Only the two lowest-scoring roles (Back-end developer and Mobile developer) had scores that were significantly different than any (in this case only two) other roles in the group. This group included the majority of traditional software developer roles, where producing code is a primary focus (back-end, mobile, embedded, desktop, full-stack, front-end, and QA/Test developers.)
大约一半的角色得分明显低于许多其他角色,并且平均满意度得分非常相似。 只有两个得分最低的角色( 后端开发人员和移动开发人员)的得分与组中的其他任何角色(在这种情况下,只有两个)显着不同。 该小组包括大多数传统软件开发人员角色,其中主要负责代码的生成(后端,移动,嵌入式,桌面,全栈,前端和QA / Test开发人员。)
最后 (Finally)
The graphics in this article provide all the information you need to make comparisons between any subset of developer types that are of interest to you. Have fun!
本文中的图形提供了您感兴趣的任何开发人员类型子集之间进行比较所需的所有信息。 玩得开心!
The code that generated these diagrams is available at: https://github.com/rickatx/SO_survey_dev_satisfaction
生成这些图的代码可在以下位置获得: https : //github.com/rickatx/SO_survey_dev_satisfaction
笔记 (Notes)
Survey features used as inputs to the regression were: Age of respondent, Age began coding, Country of residence, Compensation (converted to U.S. dollars), Developer Type (one or more types of development done by respondent), Educational Importance (self-assessed importance of education to respondent’s career), Education Level (level of formal education), Gender, Hobbyist (whether respondent codes as a hobby), Learn (frequency of learning a new language or framework), Org Size (size of respondent’s employer), Overtime (frequency of overtime work), Undergrad Major (primary field of study for college attendees), Years Coded (total number of years respondent has coded), Years Coded Professionally.
调查使用的功能作为输入的回归是:受访者的年龄 , 年龄就开始编码,居住国 , 补偿 (换算为美元), 开发类型( 一种或多种类型的发展由受访者完成的), 教育的重要性( 自我评估教育对受访者职业的重要性) , 教育水平( 正规教育水平), 性别,业余爱好者 (是否将受访者的代码作为业余爱好) , 学习 (学习新语言或框架的频率), 组织规模 (受访者雇主的规模) , 加班 ( 加班 频率) , 本科专业 ( 大学生的主要 研究领域) , 编码 年数(受访者编码的总年数) , 专业 编码 年数 。
- There were two additional types that I’ve excluded here. “Vice President” and “Marketing Professional” had few responses and don’t fit well with our interest in different types of software development. 我在这里排除了另外两种类型。 “副总裁”和“市场营销专业人士”的回应很少,也不符合我们对不同类型的软件开发的兴趣。
I estimated the distribution of the weighted mean difference for each pair of developer types with bootstrapping. An overview of bootstrapping is here.
我用自举估计了每对开发人员类型的加权平均差的分布。 引导概述在这里 。
翻译自: https://medium.com/@rick.froom/software-developers-who-has-it-better-3dfc4646e207
硬件开发和软件开发哪个更难


 1993
1993


 被折叠的 条评论
为什么被折叠?
被折叠的 条评论
为什么被折叠?
 到【灌水乐园】发言


