


 本文介绍了Probit回归模型在医学统计中的应用,该模型用于处理二元结局变量。文章详细阐述了Probit模型的原理,并通过R语言展示了如何计算边际效应,帮助读者理解模型中预测变量的影响方式。
微信公众号:医学统计与R语言
如果你觉得对你有帮助,欢迎转发
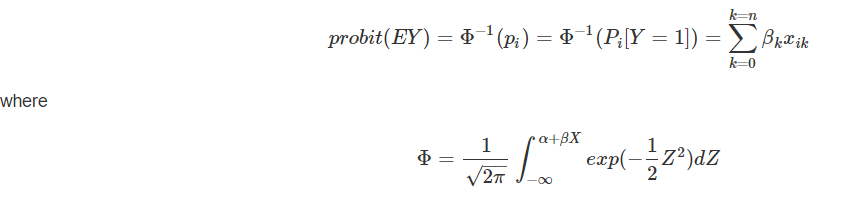
A probit regression is a version of the generalized linear model used to model dichotomous outcome variables. It uses the inverse standard normal distribution as a linear combination of the predictors. The binary outcome variable Y is assumed to have a Bernoulli distribution with parameter p (where the success probability is p∈(0,1)p∈(0,1)). Hence, the probit link function is
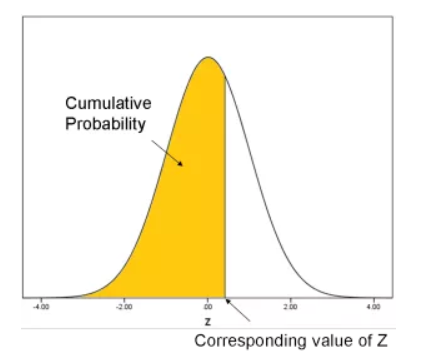
Remember back to intro stats when you had to look up in Z tables the area under the normal curve for a specific Z value? That area represents a cumulative probability: the probability that Z is less than or equal to the specified Z value.
Coefficients for probit models can be interpreted as the difference in Z score associated with each one-unit difference in the predictor variable.
Although the effect on Z of a change in X is linear, the link between z and the dependent variable Y is nonlinear since Φ is a nonlinear function of X.
输入1:
rm(list=ls())
setwd("C:/Users/mooshaa/Desktop")
library(rio)
bilog import("log.sav")
head(bilog)
bilog[,c(1,2,6)] 1,2,6)] ,as.factor)
xtabs(~Gender + Smoking_status, data = bilog)
结果1:
 Smoking_status
Gender  0  1
     0 94 27
     1 17 80
输入2:
logitmodel <- glm(Smoking_status~., data = bilog, family = binomial(link="logit"))probitmodel <- glm(Smoking_status~., data = bilog, family = binomial(link="probit"))summary(probitmodel)结果2:
Call:
glm(formula = Smoking_status ~ ., family = binomial(link = "probit"),
    data = bilog)

Deviance Residuals:
    Min       1Q
最低0.47元/天 解锁文章


 505
505

 被折叠的 条评论
为什么被折叠?
被折叠的 条评论
为什么被折叠?
 到【灌水乐园】发言


