


https://github.com/pmk2109/DataQuest/blob/master/Guided%20Project-%20Predicting%20the%20stock%20market/predict.py
1: The Dataset
Welcome to a Dataquest guided project! If you haven't gone through a guided project yet, we recommend starting with the first one in the command line course.
In this project, you'll be working with data from the S&P500 Index. The S&P500 is a stock market index. Before we get into what an index is, we'll need to get into the basics of the stock market.
Some companies are publicly traded, which means that anyone can buy and sell their shares on the open market. A share entitles the owner to some control over the direction of the company, and to some percentage (or share) of the earnings of the company. When you buy or sell shares, it's common to say that you're trading a stock.
The price of a share is based mainly on supply and demand for a given stock. For example, Apple stock has a price of 120 dollars per share as of December 2015 --http://www.nasdaq.com/symbol/aapl. A stock that is in less demand, like Ford Motor Company, has a lower price --http://finance.yahoo.com/q?s=F. Stock price is also influenced by other factors, including the number of shares a company has issued.
Stocks are traded daily, and the price can rise or fall from the beginning of a trading day to the end based on demand. Stocks that are in more in demand, such as Apple, are traded more often than stocks of smaller companies.
Indexes aggregate the prices of multiple stocks together, and allow you to see how the market as a whole is performing. For example, the Dow Jones Industrial Average aggregates the stock prices of 30 large American companies together. The S&P500 Index aggregates the stock prices of 500 large companies. When an index fund goes up or down, you can say that the underlying market or sector it represents is also going up or down. For example, if the Dow Jones Industrial Average price goes down one day, you can say that American stocks overall went down (ie, most American stocks went down in price).
You'll be using historical data on the price of the S&P500 Index to make predictions about future prices. Predicting whether an index will go up or down will help us forecast how the stock market as a whole will perform. Since stocks tend to correlate with how well the economy as a whole is performing, it can also help us make economic forecasts.
There are also thousands of traders who make money by buying and selling Exchange Traded Funds. ETFs allow you to buy and sell indexes like stocks. This means that you could "buy" the S&P500 Index ETF when the price is low, and sell when it's high to make a profit. Creating a predictive model could allow traders to make money on the stock market.
Note: You shouldn't make trades with any models developed in this mission. Trading stocks has risks, and nothing in this mission constitutes stock trading advice.
In this mission, you'll be working with a csv file containing index prices. Each row in the file contains a daily record of the price of the S&P500 Index from 1950 to 2015. The dataset was taken from here, and is stored insphist.csv.
The columns of the dataset are:
Date-- The date of the record.Open-- The opening price of the day (when trading starts).High-- The highest trade price during the day.Low-- The lowest trade price during the day.Close-- The closing price for the day (when trading is finished).Volume-- The number of shares traded.Adj Close-- The daily closing price, adjusted retroactively to include any corporate actions. Read more here.
You'll be using this dataset to develop a predictive model. You'll train the model with data from 1950-2012, and try to make predictions from 2013-2015.
Instructions
For now, just hit "Next" to get started with the project!
2: Reading In The Data
You'll need to read the data into Python, do some processing to set the right column types, and then sort the dataframe. You can do this in the predict.py script.
Instructions
Here are the steps you'll need to take, at a high level:
- Read the data into a Pandas DataFrame. You can use the
read_csvPandas function for this. - Convert the
Datecolumn to a Pandas date type. This will allow you to do date comparisons with the column.- You can perform this conversion with the to_datetimefunction in Pandas.
- Once you convert the column, you can perform comparisons with
df["Date"] > datetime(year=2015, month=4, day=1). This will generate a Boolean series that tells you if each item in theDatecolumn is after2015-04-01. You'll have to import the datetime module from the datetime library first withfrom datetime import datetime.
- Sort the dataframe on the
Datecolumn. It's currently indescending order, but we'll want it to be in ascending order for some of the next steps. You can use the sort method on Dataframes for this.
Make sure to run the predict.py script using python predict.pyas you work through the steps.
3: Generating Indicators
Datasets taken from the stock market need to be handled differently than datasets from other sectors when it comes time to make predictions. In a normal machine learning exercise, we treat each row as independent. Stock market data is sequential, and each observation comes a day after the previous observation. Thus, the observations are not all independent, and you can't treat them as such.
This means you have to be extra careful to not inject "future" knowledge into past rows when you do training and prediction. Injecting future knowledge will make our model look good when you're training and testing it, but will make it fail in the real world. This is how many algorithmic traders lose money.
The time series nature of the data means that can generate indicators to make our model more accurate. For instance, you can create a new column that contains the average price of the last 10 trades for each row. This will incorporate information from multiple prior rows into one, and will make predictions much more accurate.
When you do this, you have to be careful not to use the current row in the values you average. You want to teach the model how to predict the current price from historical prices. If you include the current price in the prices you average, it will be equivalent to handing the answers to the model upfront, and will make it impossible to use in the "real world", where you don't know the price upfront.
Here are some indicators that are interesting to generate for each row:
- The average price from the past
5days. - The average price for the past
30days. - The average price for the past
365days. - The ratio between the average price for the past
5days, and the average price for the past365days. - The standard deviation of the price over the past
5days. - The standard deviation of the price over the past
365days. - The ratio between the standard deviation for the past
5days, and the standard deviation for the past365days.
"Days" means "trading days" -- so if you're computing the average of the past 5 days, it should be the 5 most recent dates before the current one. Assume that "price" means theClose column. Always be careful not to include the current price in these indicators! You're predicting the next day price, so our indicators are designed to predict the current price from the previous prices.
Some of these indicators require a year of historical data to compute. Our first day of data falls on 1950-01-03, so the first day you can start computing indicators on is 1951-01-03.
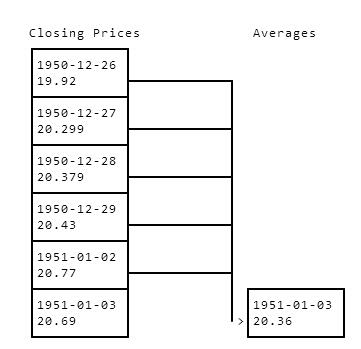
To compute indicators, you'll need to loop through each day from 1951-01-03 to 2015-12-07 (the last day you have prices for). For instance, if we were computing the average price from the past 5 days, we'd start at 1951-01-03, get the prices for each day from 1950-12-26 to 1951-01-02, and find the average. The reason why we start on the 26th, and take more than 5 calendar days into account is because the stock market is shutdown on certain holidays. Since we're looking at the past5 trading days, we need to look at more than5 calendar days to find them. Here's a diagram showing how we average 5 days to get the average closing price for 1951-01-03:
ClosingPricesAverages1950-12-2619.921950-12-2720.2991950-12-2820.3791950-12-2920.431951-01-0220.771951-01-031951-01-0320.69>20.36
You'd then move to 1951-01-04, and find the average price from 1950-12-30 to 1951-01-03. Here's a diagram showing how we might compute the average here:
ClosingPricesAverages1950-12-2619.921950-12-2720.2991950-12-2820.3791950-12-2920.431951-01-0220.771951-01-031951-01-0320.6920.361951-01-041951-01-0420.87>20.514
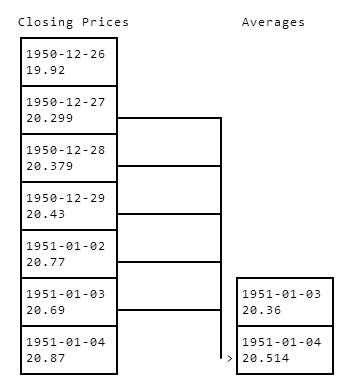
We'd keep repeating this process to compute all of the averages. Note how when we compute the average of the past 5 days for 1951-01-04, we don't include 1951-01-04 in that average. It's critical not to do this, or our model won't work in the "real world".
Here's a table of how the first 10 dates would look if we computed the 5 day average closing price. Close is the closing price for that day, and day_5 is the average of the past 5trading closing prices at each row:
| Date | Close | day_5 | |
|---|---|---|---|
| 16339 | 1951-01-03 | 20.690001 | 20.360000 |
| 16338 | 1951-01-04 | 20.870001 | 20.514000 |
| 16337 | 1951-01-05 | 20.870001 | 20.628000 |
| 16336 | 1951-01-08 | 21.000000 | 20.726001 |
| 16335 | 1951-01-09 | 21.120001 | 20.840001 |
| 16334 | 1951-01-10 | 20.850000 | 20.910001 |
| 16333 | 1951-01-11 | 21.190001 | 20.942001 |
| 16332 | 1951-01-12 | 21.110001 | 21.006001 |
| 16331 | 1951-01-15 | 21.299999 | 21.054001 |
| 16330 | 1951-01-16 | 21.459999 | 21.114000 |
Instructions
Pick 3 indicators to compute, and generate a different column for each one.
There are a few different ways to do this:
- You can use a for loop along with the iterrows method to loop over the rows in the DataFrame and compute the indicators. This is the recommended way, as it's a bit simpler to understand what's happening. Since you'll be looping over all of the rows, for any date that comes before there is enough historical data to compute an indicator, just fill in
0. - Pandas has some time series tools that can help, including therolling_mean function, which will do most of the hard computation for you. Set the
windowequal to the number of trading days in the past you want to use to compute the indicators. This will add inNaNvalues for any row where there aren't enough historical trading days to do the computation. Note: There is a giant caveat here, which is that the rolling mean will use the current day's price. You'll need to reindex the resulting series to shift all the values "forward" one day. For example, the rolling mean calculated for1950-01-03will need to be assigned to1950-01-04, and so on. You can use the shiftmethod on Dataframes to do this.
4: Splitting Up The Data
Since you're computing indicators that use historical data, there are some rows where there isn't enough historical data to generate them. Some of the indicators use 365 days of historical data, and the dataset starts on 1950-01-03. Thus, any rows that fall before 1951-01-03 don't have enough historical data to compute all the indicators. You'll need to remove these rows before you split the data.
If you have a Dataframe df, you can select any rows with the Date column greater than1951-01-02 using df[df["Date"] > datetime(year=1951, month=1, day=2)].
Instructions
- Remove any rows from the DataFrame that fall before
1951-01-03. - Use the dropna method to remove any rows with
NaNvalues. Pass in theaxis=0argument to drop rows. - Generate two new dataframes to use in making our algorithm.
trainshould contain any rows in the data with a date less than2013-01-01.testshould contain any rows with a date greater than or equal to2013-01-01.
5: Making Predictions
Now, you can define an error metric, train a model using the train data, and make predictions on the test data.
It's recommended to use Mean Absolute Error, also called MAE, as an error metric, because it will show you how "close" you were to the price in intuitive terms. Mean Squared Error, or MSE, is an alternative that is more commonly used, but makes it harder to intuitively tell how far off you are from the true price because it squares the error.
Instructions
- Pick an error metric.
- Initialize a LinearRegression classifier.
- Train the LinearRegression classifier, using the
trainDataframe. Leave out all of the original columns (Close,High,Low,Open,Volume,Adj Close,Date) when training your model. These all contain knowledge of the future that you don't want to feed the model. Use theClosecolumn as the target. - Make predictions for the
Closecolumn of thetestdata, using the same columns for training as you did withtrain. - Compute the error between the predictions and the
Closecolumn oftest.
6: Improving Error
Congratulations! You can now predict the S&P500 (with some error). You can improve the error of this model significantly, though. Think about some indicators that might be helpful to compute.
Here are some ideas that might be helpful:
- The average volume over the past five days.
- The average volume over the past year.
- The ratio between the average volume for the past five days, and the average volume for the past year.
- The standard deviation of the average volume over the past five days.
- The standard deviation of the average volume over the past year.
- The ratio between the standard deviation of the average volume for the past five days, and the standard deviation of the average volume for the past year.
- The year component of the date.
- The ratio between the lowest price in the past year and the current price.
- The ratio between the highest price in the past year and the current price.
- The year component of the date.
- The month component of the date.
- The day of week.
- The day component of the date.
- The number of holidays in the prior month.
Instructions
Add 2 additional indicators to your dataframe, and see if the error is reduced. You'll need to insert these indicators at the same point where you insert the others, before you clean out rows with NaNvalues and split the dataframe into train and `test.
7: Next Steps
There's a lot of improvement still to be made on the indicator side, and we urge you to think of better indicators that you could use for prediction.
We can also make significant structural improvements to the algorithm, and pull in data from other sources.
Accuracy would improve greatly by making predictions only one day ahead. For example, train a model using data from 1951-01-03 to2013-01-02, make predictions for 2013-01-03, and then train another model using data from 1951-01-03 to 2013-01-03, make predictions for 2013-01-04, and so on. This more closely simulates what you'd do if you were trading using the algorithm.
You can also improve the algorithm used significantly. Try other techniques, like a random forest, and see if they perform better.
You can also incorporate outside data, such as the weather in New York City (where most trading happens) the day before, and the amount of Twitter activity around certain stocks.
You can also make the system real-time by writing an automated script to download the latest data when the market closes, and make predictions for the next day.
Finally, you can make the system "higher-resolution". You're currently making daily predictions, but you could make hourly, minute-by-minute, or second by second predictions. This will require obtaining more data, though. You could also make predictions for individual stocks instead of the S&P500.
You can write scripts and explore here, or download the code to your computer using thedownload icon to the right. You'll then be able to run the scripts on your own computer.
We hope this guided project has been a good experience, and please email us at hello@dataquest.io if you want to share your work. We'd love to see it!


 3339
3339

 被折叠的 条评论
为什么被折叠?
被折叠的 条评论
为什么被折叠?
 到【灌水乐园】发言


