


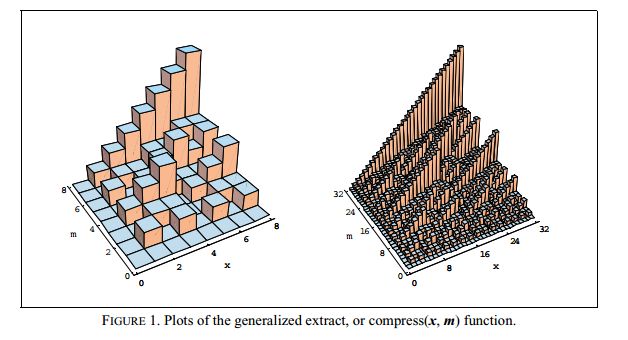
I want to make plots like these from Hacker's Delight:
What ways are there to accomplish this in Python? A solution that makes it easy to interactively adjust the graph (changing the slice of X/Y currently being observed) would be ideal.
Neither matplotlib nor the mplot3d module have this functionality AFAICT. I found mayavi2 but it's extremely clunky (I can't even find the option for adjusting the sizes) and only seems to work correctly when run from ipython.
Alternatively gnuplot could work, but I'd hate to have to learn another language syntax just for this.
解决方案
Since the example pointed out by TJD seemed "impenetrable" here is a modified version with a few comments that might help clarify things:
#! /usr/bin/env python
from mpl_toolkits.mplot3d import Axes3D
import matplotlib.pyplot as plt
import numpy as np
#
# Assuming you have "2D" dataset like the following that you need
# to plot.
#
data_2d = [ [1, 2, 3, 4, 5, 6, 7, 8, 9, 10],
[6, 7, 8, 9, 10, 11, 12, 13, 14, 15],
[11, 12, 13, 14, 15, 16, 17, 18 , 19, 20],
[16, 17, 18, 19, 20, 21, 22, 23, 24, 25],
[21, 22, 23, 24, 25, 26, 27, 28, 29, 30] ]
#
# Convert it into an numpy array.
#
data_array = np.array(data_2d)
#
# Create a figure for plotting the data as a 3D histogram.
#
fig = plt.figure()
ax = fig.add_subplot(111, projection='3d')
#
# Create an X-Y mesh of the same dimension as the 2D data. You can
# think of this as the floor of the plot.
#
x_data, y_data = np.meshgrid( np.arange(data_array.shape[1]),
np.arange(data_array.shape[0]) )
#
# Flatten out the arrays so that they may be passed to "ax.bar3d".
# Basically, ax.bar3d expects three one-dimensional arrays:
# x_data, y_data, z_data. The following call boils down to picking
# one entry from each array and plotting a bar to from
# (x_data[i], y_data[i], 0) to (x_data[i], y_data[i], z_data[i]).
#
x_data = x_data.flatten()
y_data = y_data.flatten()
z_data = data_array.flatten()
ax.bar3d( x_data,
y_data,
np.zeros(len(z_data)),
1, 1, z_data )
#
# Finally, display the plot.
#
plt.show()


 1170
1170


 被折叠的 条评论
为什么被折叠?
被折叠的 条评论
为什么被折叠?
 到【灌水乐园】发言


