


需求:
原数据:https://sampleserver6.arcgisonline.com/arcgis/rest/services/Census/MapServer/2(美国2000 年人口普查中的各种人口统计数据,包括总人口、人口密度、种族计数等)
需求:
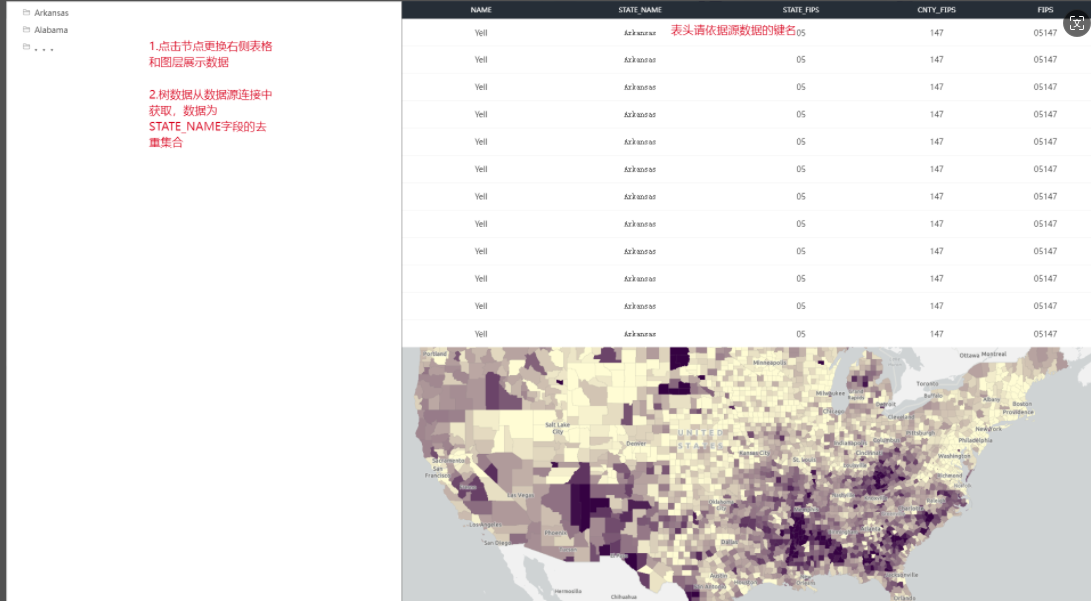
1. 整体架构和UI
左侧为树菜单,点击节点切换右侧列表,右侧列表展示对应州的名称(STATE_NAME字段),右侧展示该州的所有地块的详细信息。
比如:树菜单点击Alabama的节点,右侧列表数据更换为Alabama所有地块的数据,同时地图地块展示与右侧表格同步,只展示Alabama所有地块的数据。2. 地图交互
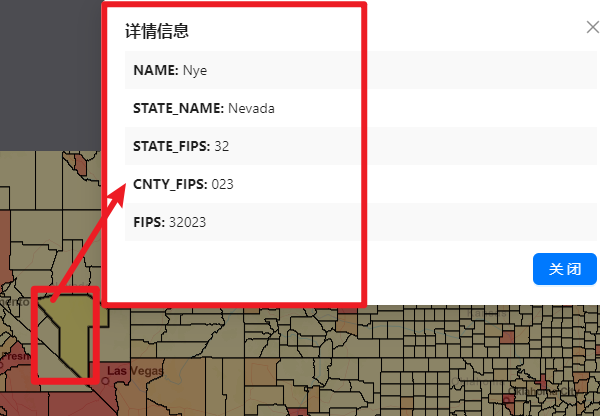
点击地块时,弹出弹框,展示地块的详细信息,弹框内容为地块详情的键值对列表。3. 图层展示
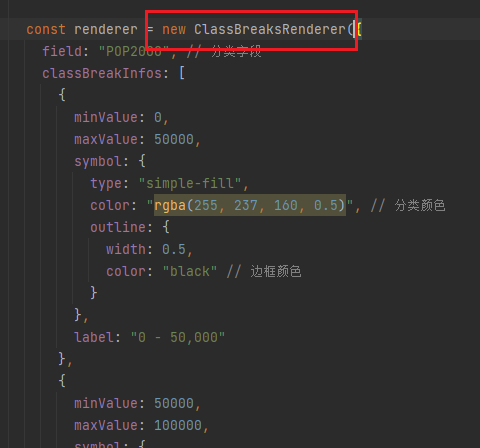
地图地块展示,地块颜色根据字段“POP2000”,如果字段该数值为0至5万使用一个颜色,5万至10万使用一个颜色,10万至15万使用一个颜色,15万至20万使用一个颜色,20万至50万使用一个颜色,50万以上使用一个颜色4.数据定位
点击右侧表格某条数据,地图聚焦定位到该地块,弹出该地块弹框5.数据报表
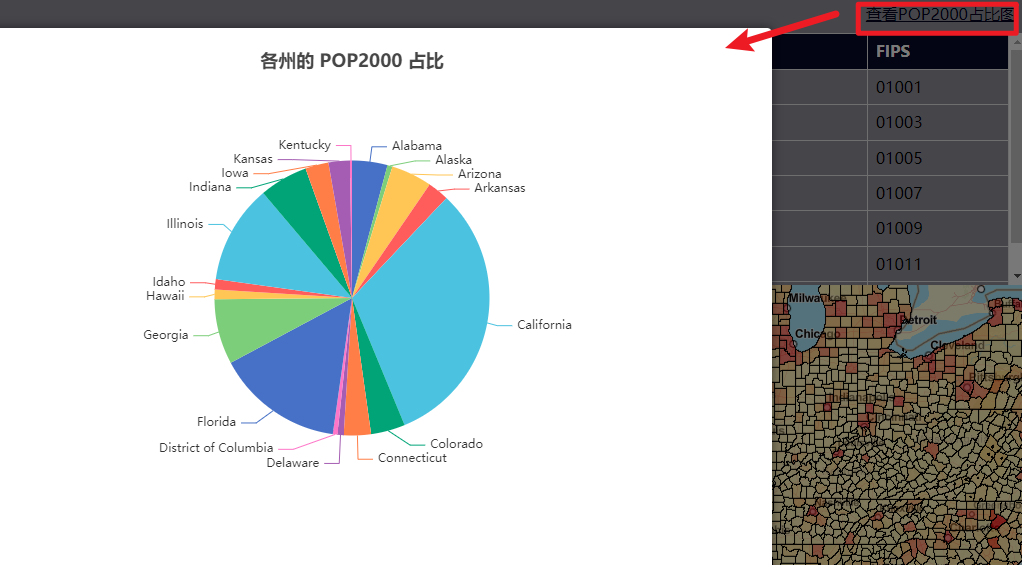
点击右侧表格统计按钮,打开弹框,弹框内容为各个州的"POP2000"字段的占比和数量统计,使用饼图技术栈要求:地图库-ArcGIS js ,前端框架-vue3+ts
图片参考:
App.vue:
<template>
  <div style="display: flex; height: 100vh; background-color: #8B8B94FF;">
    <!-- 整个页面的容器,设置为弹性布局,填满整个视口高度,背景颜色为 #8B8B94FF -->

    <a-layout>
      <!-- 使用 Ant Design Vue 的 Layout 组件来布局 -->

      <a-layout-sider>
        <!-- 侧边栏区域 -->

        <div id="stateList">
          <!-- 状态列表的容器 -->
          <ul>
            <!-- 状态名称列表 -->
            <li v-for="state in stateNames" :key="state" @click="filterByState(state)">
              <!-- 循环显示每个状态,点击时调用 filterByState 方法 -->
              <EnvironmentOutlined /> {{ state }}
              <!-- 显示图标和状态名称 -->
            </li>
          </ul>
        </div>

      </a-layout-sider>
    </a-layout>

    <div style="width: 80%; display: flex; flex-direction: column;">
      <!-- 主内容区域,宽度为 80%,使用弹性布局,垂直方向排列 -->

<!--      饼图弹出框-->
      <div id="viewModal">
        <!-- 查看POP2000占比图的按钮和模态框 -->

        <div
            style="width: 100%; text-align: right; color: #03031EFF; padding: 10px; cursor: pointer; text-decoration: underline"
            @click="showModalClick"
        >
          <!-- 显示“查看POP2000占比图”的按钮,点击时调用 showModalClick 方法 -->
          查看POP2000占比图
        </div>

        <div v-if="showModal" class="modal-wrapper" @click="closeModal">
          <!-- 如果 showModal 为 true,则显示模态框的容器 -->
          <div id="customModal" class="modal-content" @click.stop>
            <!-- 模态框内容,点击时阻止事件冒泡 -->
            <div ref="chartRef" style="width: 800px; height: 500px;"></div>
            <!-- 图表容器,引用名称为 chartRef -->
            <button @click="closeModal">关闭</button>
            <!-- 关闭按钮,点击时调用 closeModal 方法 -->
          </div>
        </div>
      </div>

<!--      ant-desgin的 洲详情弹出框-->
      <a-modal
          v-model:visible="showZhouModal"
          title="详情信息"
          @ok="closeZhouModal"
          @cancel="closeZhouModal"
      >
        <!-- Ant Design Vue 的模态框组件,用于显示详细信息 -->
        <div class="zhou-details">
          <!-- 详细信息的容器 -->
          <p class="row even"><strong>NAME:</strong> {{ zhouAttributes.NAME }}</p>
          <!-- 显示 NAME 属性 -->
          <p class="row odd"><strong>STATE_NAME:</strong> {{ zhouAttributes.STATE_NAME }}</p>
          <!-- 显示 STATE_NAME 属性 -->
          <p class="row even"><strong>STATE_FIPS:</strong> {{ zhouAttributes.STATE_FIPS }}</p>
          <!-- 显示 STATE_FIPS 属性 -->
          <p class="row odd"><strong>CNTY_FIPS:</strong> {{ zhouAttributes.CNTY_FIPS }}</p>
          <!-- 显示 CNTY_FIPS 属性 -->
          <p class="row even"><strong>FIPS:</strong> {{ zhouAttributes.FIPS }}</p>
          <!-- 显示 FIPS 属性 -->
        </div>
        <template #footer>
          <!-- 自定义模态框的页脚 -->
          <a-button type="primary" @click="closeZhouModal">关闭</a-button>
          <!-- 关闭按钮,点击时调用 closeZhouModal 方法 -->
        </template>
      </a-modal>

      <div id="tableDiv" style="height: 40%; overflow-y: auto;"></div>
      <!-- 表格的容器,设置高度为 40%,垂直方向可滚动 -->

      <div id="viewDiv" style="height: 50%;"></div>
      <!-- 视图的容器,设置高度为 50% -->

    </div>
  </div>
</template>

<script>
import { defineComponent, nextTick, onMounted, onUnmounted, ref } from 'vue';
// 从 Vue 中导入需要的 API:defineComponent(定义组件)、nextTick(在 DOM 更新后执行某些操作)、onMounted(组件挂载时执行的生命周期钩子)、onUnmounted(组件卸载时执行的生命周期钩子)和 ref(用于创建响应式引用)。

import Map from "@arcgis/core/Map";
// 从 ArcGIS API for JavaScript 中导入 Map 类,用于创建地图实例。

import MapView from "@arcgis/core/views/MapView";
// 从 ArcGIS API for JavaScript 中导入 MapView 类,用于在浏览器中显示地图。

import FeatureLayer from "@arcgis/core/layers/FeatureLayer";
// 从 ArcGIS API for JavaScript 中导入 FeatureLayer 类,用于显示地图上的要素图层。

import GraphicsLayer from "@arcgis/core/layers/GraphicsLayer";
// 从 ArcGIS API for JavaScript 中导入 GraphicsLayer 类,用于在地图上显示图形图层。

import Graphic from "@arcgis/core/Graphic";
// 从 ArcGIS API for JavaScript 中导入 Graphic 类,用于创建和管理地图上的图形。

import ClassBreaksRenderer from "@arcgis/core/renderers/ClassBreaksRenderer";
// 从 ArcGIS API for JavaScript 中导入 ClassBreaksRenderer 类,用于根据数据值范围对图层进行分类和渲染。

import * as echarts from 'echarts';
// 导入 ECharts 库,用于创建图表。

// 使用这些导入的模块,可以在 Vue 组件中创建和管理 ArcGIS 地图和图层,
// 并使用 ECharts 库在地图上显示图表。


export default defineComponent({
  name: "App",

  setup() {
    // 定义响应式变量
    const stateNames = ref([]); // 存储所有州名称
    const featuresByState = ref({}); // 存储按州划分的要素数据
    const showModal = ref(false); // 控制模态框显示
    const showZhouModal = ref(false); // 控制周模态框显示
    const zhouAttributes = ref({ NAME: '', STATE_NAME: '', STATE_FIPS: '', CNTY_FIPS: '', FIPS: '' }); // 存储选择的要素属性

    let pieChartData = ref([]); // 存储饼图数据
    let highlightLayer = ref([]); // 存储高亮图层
    let highlightGraphic = ref([]); // 存储高亮要素
    let map = ref([]); // 存储地图对象

    // 关闭模态框
    const closeModal = () => {
      showModal.value = false;
    };

    // 关闭周模态框
    const closeZhouModal = () => {
      showZhouModal.value = false;
    };

    const chartRef = ref(null); // 存储图表引用
    let chartInstance = null; // 存储图表实例

    const featureLayerUrl = "https://sampleserver6.arcgisonline.com/arcgis/rest/services/Census/MapServer/2"; // 要素图层URL
    let view; // 存储地图视图对象

    // 显示模态框并在下一次 DOM 更新后初始化图表  ----展示饼图注意点:先获取数据后加载饼图nextTick
    const showModalClick = () => {
      showModal.value = true;
      nextTick(() => {
        if (chartRef.value) {
          chartInstance = echarts.init(chartRef.value);
          updatePieChart(pieChartData);
        }
      });
    };

    // 填充表格
    function populateTable(features, state_name) {
      const tableDiv = document.getElementById("tableDiv");
      tableDiv.innerHTML = ""; // 清空表格内容

      const table = document.createElement("table");

      // 创建表头
      const headerRow = document.createElement("tr");
      const headers = ["NAME", "STATE_NAME", "STATE_FIPS", "CNTY_FIPS", "FIPS"];
      headers.forEach(headerText => {
        const th = document.createElement("th");
        th.textContent = headerText;
        th.style.backgroundColor = '#080828FF'; // 表头背景色
        th.style.color = '#f2f2f2'; // 表头文字颜色
        headerRow.appendChild(th);
      });
      table.appendChild(headerRow);

      // 默认显示阿拉巴马州的数据
      if (!state_name) state_name = 'Alabama';
      console.log(state_name);
      const filteredFeatures = features.filter(feature => feature.attributes["STATE_NAME"] === state_name);

      // 填充表格数据
      filteredFeatures.forEach(feature => {
        const row = document.createElement("tr");
        headers.forEach(field => {
          const td = document.createElement("td");
          td.textContent = feature.attributes[field];
          row.appendChild(td);
        });
        row.style.cursor = "pointer"; // 设置鼠标悬停样式
        row.addEventListener("click", () => {
          zoomToFeature(feature); // 点击行时缩放到该要素
        });
        table.appendChild(row);
      });

      tableDiv.appendChild(table);
    }

    // 缩放到特定要素并高亮
    function zoomToFeature(feature) {
      highlightLayer.removeAll(); // 移除所有高亮图层

      highlightGraphic = new Graphic({
        geometry: feature.geometry,
        symbol: {
          type: "simple-fill",
          color: [255, 255, 0, 0.5], // 高亮颜色
          style: "solid",
          outline: {
            color: [0, 0, 0], // 高亮边框颜色
            width: 2
          }
        }
      });
      highlightLayer.add(highlightGraphic); // 添加高亮图层

      map.reorder(highlightLayer, map.layers.length - 1); // 重新排列图层顺序

      view.goTo({
        target: feature.geometry,
        zoom: 6
      }).then(() => {
        // 更新模态框中的要素属性
        const attributes = feature.attributes;
        zhouAttributes.value.NAME = attributes.NAME;
        zhouAttributes.value.STATE_NAME = attributes.STATE_NAME;
        zhouAttributes.value.STATE_FIPS = attributes.STATE_FIPS;
        zhouAttributes.value.CNTY_FIPS = attributes.CNTY_FIPS;
        zhouAttributes.value.FIPS = attributes.FIPS;
        showZhouModal.value = true; // 显示周模态框
      });
    }

    onMounted(() => {
      map = new Map({
        basemap: "streets" // 设置底图类型
      });

      view = new MapView({
        container: "viewDiv", // 地图容器
        map: map,
        zoom: 4, // 初始缩放级别
        center: [-98.35, 39.50] // 中心点坐标
      });

      highlightLayer = new GraphicsLayer(); // 创建高亮图层
      view.map.add(highlightLayer); // 添加高亮图层到地图

      const renderer = new ClassBreaksRenderer({
        field: "POP2000", // 分类字段
        classBreakInfos: [
          {
            minValue: 0,
            maxValue: 50000,
            symbol: {
              type: "simple-fill",
              color: "rgba(255, 237, 160, 0.5)", // 分类颜色
              outline: {
                width: 0.5,
                color: "black" // 边框颜色
              }
            },
            label: "0 - 50,000"
          },
          {
            minValue: 50000,
            maxValue: 100000,
            symbol: {
              type: "simple-fill",
              color: "rgba(254, 217, 118, 0.5)",
              outline: {
                width: 0.5,
                color: "black"
              }
            },
            label: "50,000 - 100,000"
          },
          {
            minValue: 100000,
            maxValue: 150000,
            symbol: {
              type: "simple-fill",
              color: "rgba(254, 178, 76, 0.5)",
              outline: {
                width: 0.5,
                color: "black"
              }
            },
            label: "100,000 - 150,000"
          },
          {
            minValue: 150000,
            maxValue: 200000,
            symbol: {
              type: "simple-fill",
              color: "rgba(253, 141, 60, 0.5)",
              outline: {
                width: 0.5,
                color: "black"
              }
            },
            label: "150,000 - 200,000"
          },
          {
            minValue: 200000,
            maxValue: 500000,
            symbol: {
              type: "simple-fill",
              color: "rgba(252, 78, 42, 0.5)",
              outline: {
                width: 0.5,
                color: "black"
              }
            },
            label: "200,000 - 500,000"
          },
          {
            minValue: 500000,
            maxValue: Infinity,
            symbol: {
              type: "simple-fill",
              color: "rgba(227, 26, 28, 0.5)",
              outline: {
                width: 0.5,
                color: "black"
              }
            },
            label: "500,000+"
          }
        ]
      });

     /* FeatureLayer解析Gis地址Url*/
      const featureLayer = new FeatureLayer({
        url: featureLayerUrl,
        outFields: ["NAME", "STATE_NAME", "STATE_FIPS", "CNTY_FIPS", "FIPS", "POP2000"], // 请求字段
        renderer: renderer // 设置渲染器
      });

      map.add(featureLayer); // 将要素图层添加到地图

      view.when(() => {
        // 尝试从 localStorage 获取州名称和人口数据
        let storedStateNames = JSON.parse(localStorage.getItem('stateNames'));
        let sotredPop2000ByState = JSON.parse(localStorage.getItem('pop2000ByState'));
        let pop2000ByState = {};
        if (storedStateNames) {
          console.log("缓存")
          // 如果存在本地存储的数据,则直接使用
          stateNames.value = storedStateNames;
          pop2000ByState = sotredPop2000ByState;

          pieChartData = Object.keys(pop2000ByState).map(state => {
            return { name: state, value: pop2000ByState[state] };
          });
        } else {
          console.log("非缓存")
          // 如果没有本地存储的数据,则进行查询
          const left_query = createFeatureLayerQuery(featureLayer, 'all', 1000);
          queryAllFeatures(featureLayer, left_query).then(left_data_result => {
            populateTable(left_data_result); // 填充表格
            const stateSet = new Set();

            left_data_result.forEach(feature => {
              const state_name = feature.attributes["STATE_NAME"];
              const pop2000 = feature.attributes["POP2000"];
              stateSet.add(state_name);
              if (pop2000ByState[state_name]) {
                pop2000ByState[state_name] += pop2000;
              } else {
                pop2000ByState[state_name] = pop2000;
              }
            });

            // 更新响应式变量
            stateNames.value = Array.from(stateSet);
            pieChartData = Object.keys(pop2000ByState).map(state => {
              return { name: state, value: pop2000ByState[state] };
            });

            // 将州名称和人口数据存储到 localStorage
            localStorage.setItem('stateNames', JSON.stringify(stateNames.value));
            localStorage.setItem('pop2000ByState', JSON.stringify(pop2000ByState));
          }).catch(error => {
            console.error("查询要素时出错: ", error);
          });
        }

        // 地图点击事件处理
        view.on("click", (event) => {
          view.hitTest(event).then(response => {
            if (response.results.length > 0) {
              const graphic = response.results.filter(result => {
                return result.graphic.layer === featureLayer;
              })[0].graphic;
              const attributes = graphic.attributes;

              // 更新模态框中的要素属性
              zhouAttributes.value.NAME = attributes.NAME;
              zhouAttributes.value.STATE_NAME = attributes.STATE_NAME;
              zhouAttributes.value.STATE_FIPS = attributes.STATE_FIPS;
              zhouAttributes.value.CNTY_FIPS = attributes.CNTY_FIPS;
              zhouAttributes.value.FIPS = attributes.FIPS;

              // 高亮显示点击的要素
              highlightLayer.removeAll();
              const highlightGraphic = new Graphic({
                geometry: graphic.geometry,
                symbol: {
                  type: "simple-fill",
                  color: [255, 255, 0, 0.5],
                  outline: {
                    color: [0, 0, 0],
                    width: 2
                  }
                }
              });
              highlightLayer.add(highlightGraphic);

              showZhouModal.value = true; // 显示周模态框
            }
          });
        });
      }).catch(error => {
        console.error("地图加载时出错: ", error);
      });

      /*初始化右侧Table数据*/
      const right_query = createFeatureLayerQuery(featureLayer,'Alabama');
      queryAllFeatures(featureLayer, right_query).then(right_data_result => {
        populateTable(right_data_result);
      }).catch(error => {
        console.error("查询特征时出错: ", error);
      });


    });

    onUnmounted(() => {
      if (chartInstance) {
        chartInstance.dispose(); // 销毁图表实例
      }
    });

    // 更新饼图数据
    const updatePieChart = (data) => {
      const option = {
        title: {
          text: '各州的 POP2000 占比',
          left: 'center'
        },
        tooltip: {
          trigger: 'item'
        },
        series: [
          {
            name: 'POP2000',
            type: 'pie',
            radius: '55%',
            data: data,
            emphasis: {
              itemStyle: {
                shadowBlur: 10,
                shadowOffsetX: 0,
                shadowColor: 'rgba(0, 0, 0, 0.5)'
              }
            }
          }
        ]
      };
      chartInstance.setOption(option);
    };

    // 根据州名称过滤数据
    function filterByState(state) {
      const featureLayer = new FeatureLayer({
        url: featureLayerUrl
      });

      const query = createFeatureLayerQuery(featureLayer, state);

      queryAllFeatures(featureLayer, query).then(allFeaturesResult => {
        populateTable(allFeaturesResult, state); // 填充表格数据
      }).catch(error => {
        console.error("查询特征时出错: ", error);
      });
    }

    // 创建特征图层查询
    function createFeatureLayerQuery(layer, stateName, num) {
      const query = layer.createQuery();
      query.outFields = ["NAME", "STATE_NAME", "STATE_FIPS", "CNTY_FIPS", "FIPS", "POP2000"];
      query.returnGeometry = true;
      if (!num) {
        num = 7;
      }
      query.num = num;
      query.start = 0;
      if (stateName != 'all') {
        query.where = `STATE_NAME = '${stateName}'`; // 设置查询条件
      }
      return query;
    }

    // 查询所有特征
    function queryAllFeatures(layer, query) {
      return layer.queryFeatures(query).then(result => {
        return result.features;
      }).catch(error => {
        console.error("查询特征时出错: ", error);
      });
    }

    // 返回响应式变量和方法
    return {
      stateNames,
      filterByState,
      showModal,
      closeModal,
      zhouAttributes,
      showZhouModal,
      closeZhouModal,
      chartRef,
      showModalClick
    };
  }


});
</script>

<style>

html, body, #viewDiv, #tableDiv {
  padding: 0;
  margin: 0;
  width: 100%;
}

#tableDiv {
  overflow: auto;
}

table {
  width: 100%;
  border-collapse: collapse;
}

th, td {
  padding: 8px;
  text-align: left;
  border: 1px solid #ddd;
}

th {
  background-color: #f2f2f2;
}


.modal-wrapper {
  position: fixed;
  top: 0;
  left: 0;
  width: 100%;
  height: 100%;
  background-color: rgba(0, 0, 0, 0.5);
  display: flex;
  justify-content: center;
  align-items: center;
}

.modal-content {
  background-color: white;
  padding: 20px;
  border-radius: 5px;
  box-shadow: 0px 0px 10px rgba(0, 0, 0, 0.5);
}

button {
  margin-top: 10px;
}

#stateList {
  width: 136%;
  overflow-y: auto;
  border-right: 1px solid #ddd;
  background: linear-gradient(180deg, #8b8b94, #04042a);
  color: white;
}
#stateList ul {
  list-style: none;
  padding: 0;
}
#stateList li {
  padding: 10px;
  cursor: pointer;
}
#stateList li:hover {
  background-color: rgba(255, 255, 255, 0.2);
}

.even {
  background-color: #f9f9f9;
}

.odd {
  background-color: #ffffff;
}

.zhou-details p {
  margin: 0;
  padding: 8px;
}

</style>
注释总结:
setup()函数初始化了一些响应式变量和方法。onMounted和onUnmounted钩子用于在组件挂载和卸载时执行初始化和清理操作。populateTable函数用于填充表格数据。zoomToFeature函数用于缩放到特定要素并高亮显示。updatePieChart函数用于更新饼图数据。filterByState函数用于根据州名称过滤数据。createFeatureLayerQuery和queryAllFeatures函数用于创建和执行特征图层查询。通过这些注释和解释,可以更好地理解代码的结构和每个部分的功能。
main.js:
// import './assets/main.css'
// 导入全局的 CSS 文件。如果需要全局样式,可以取消注释此行。

import { createApp } from 'vue'
// 从 Vue 包中导入 createApp 函数,用于创建 Vue 应用实例。

import { createPinia } from 'pinia'
// 从 Pinia 包中导入 createPinia 函数,用于创建 Pinia 状态管理实例。

import App from './App.vue'
// 导入应用的根组件 App.vue。

import router from './router'
// 导入应用的路由配置。

import Antd from 'ant-design-vue'
// 导入 Ant Design Vue 库,用于 UI 组件。

import 'ant-design-vue/dist/reset.css'
// 导入 Ant Design Vue 的重置样式表,确保组件样式一致。

import { EnvironmentOutlined } from '@ant-design/icons-vue'
// 从 Ant Design 图标库中导入一个特定的图标(EnvironmentOutlined)。

const app = createApp(App)
// 创建一个 Vue 应用实例,并将根组件 App 作为参数传入。

app.use(createPinia())
// 使用 Pinia 插件,启用状态管理功能。类似Vuex

app.use(router)
// 使用路由插件,启用路由功能。

app.use(Antd)
// 使用 Ant Design Vue 插件,启用 UI 组件库。

app.component('EnvironmentOutlined', EnvironmentOutlined)
// 注册一个全局组件 'EnvironmentOutlined',对应导入的图标组件。

app.mount('#app')
// 挂载应用实例到页面上的 DOM 元素(id 为 'app' 的元素),开始渲染整个应用。
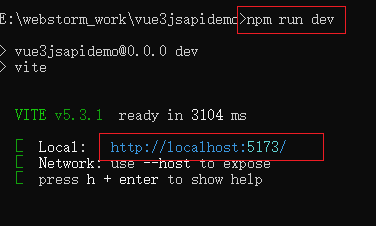
运行:
展示:

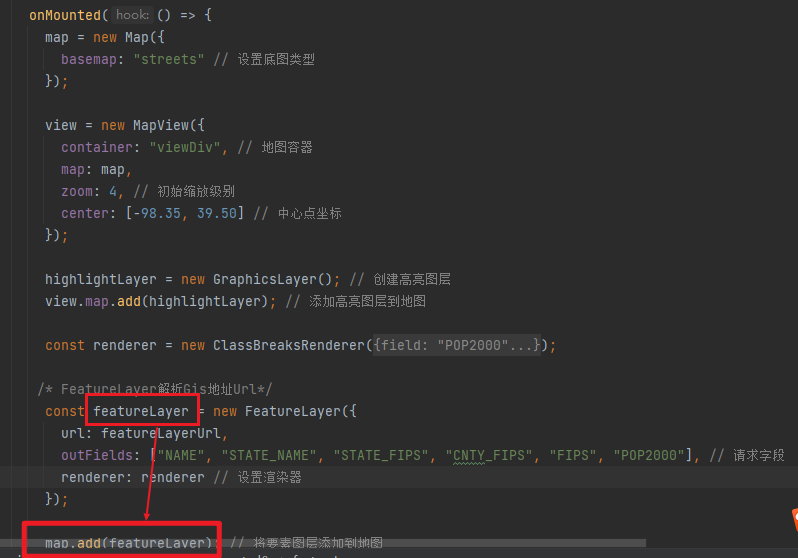
代码解析:
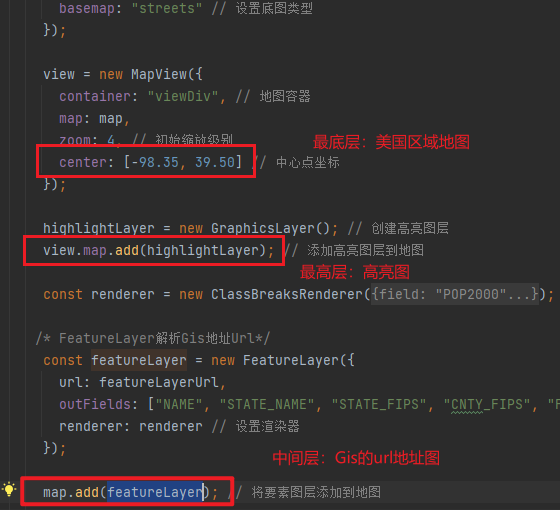
将Gis的url地址进行解析后渲染到地图中:
获取左侧的洲列表 和 右上的table数据(通过query)
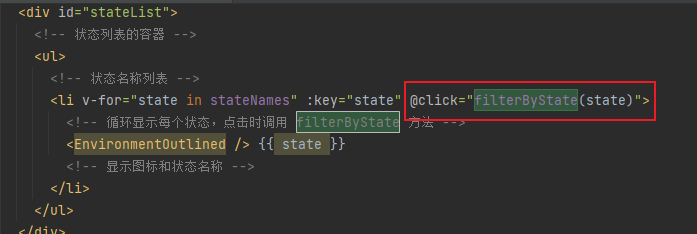
点击左侧的洲名称获取和更新右上的table数据:
点击按钮:
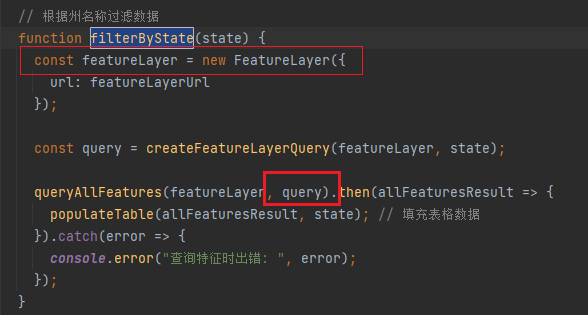
重新解析Gis的url地址数据并且query:
总结: 地图直接new FeatureLayer解析,但是获取数据要通过query获取。
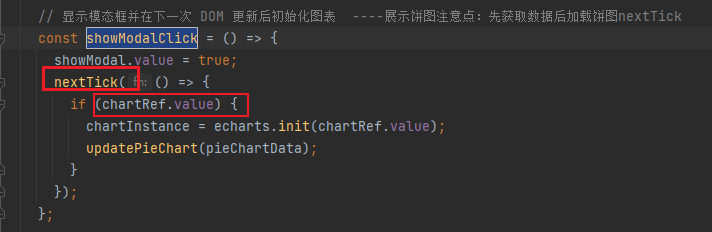
获取饼状图:
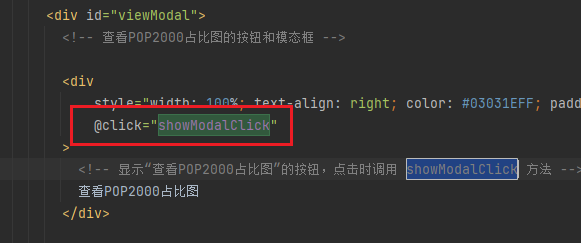
点击按钮弹出Modal:
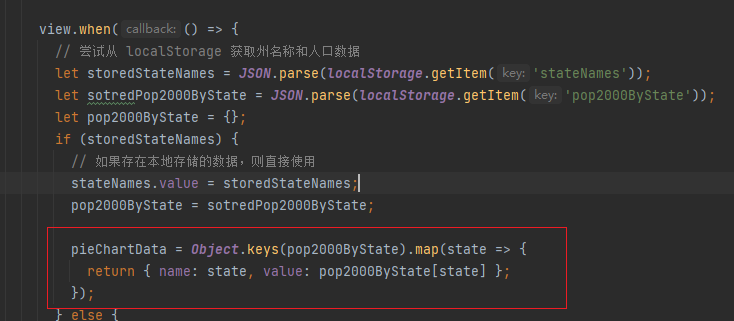
如果有饼状数据:
饼状数据一开始onMounted就已经加载好了
有缓存的时候:
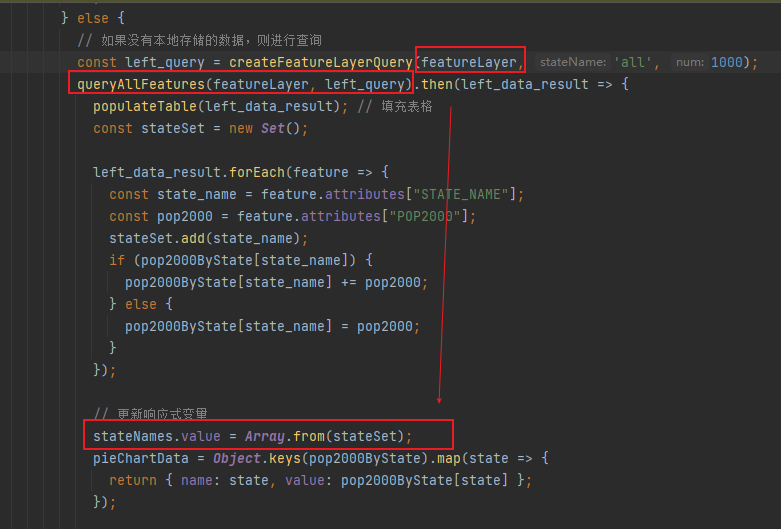
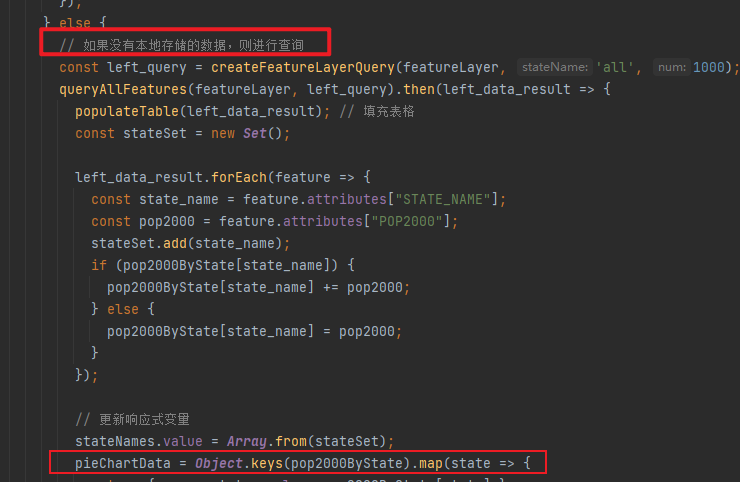
无缓存的时候:
三个图层:
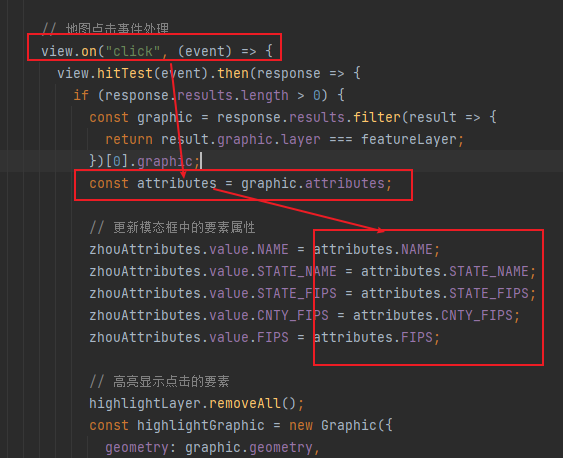
点击地图的事件:弹出Modal详情信息和高亮区域:
首页刚进入的时候初始化的Alabama数据:
 /*初始化右侧Table数据*/
      const right_query = createFeatureLayerQuery(featureLayer,'Alabama');
      queryAllFeatures(featureLayer, right_query).then(right_data_result => {
        populateTable(right_data_result);
      }).catch(error => {
        console.error("查询特征时出错: ", error);
      });
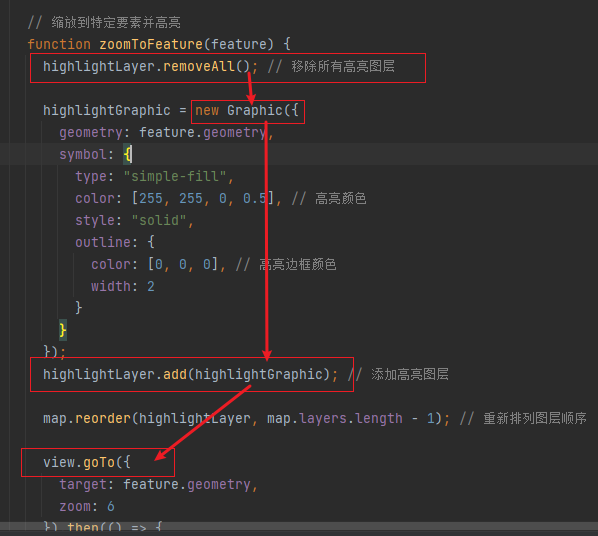
点击右侧table 表格行的事件:弹出Modal框并高亮
点击的事件是写在生成表格的方法中:


如何处理高亮逻辑:(先清除其他的高亮+new Graphic 创建高亮+添加add高亮+goto高亮的位置)
根据某一个字段来设置图层的颜色块:


 1919
1919


 被折叠的 条评论
为什么被折叠?
被折叠的 条评论
为什么被折叠?
 到【灌水乐园】发言


