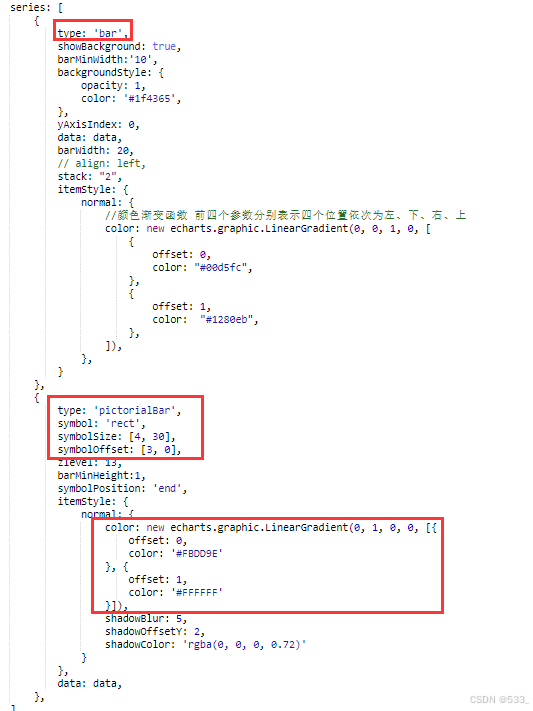

具体:
https://echarts.zhangmuchen.top/#/detail?cid=28ea6-0601-e9f5-9cc29-c022b758
let data = [
      {value: 0,name: '数据格式一'},
      {value: 55,name: '数据格式二'},
      {value: 66,name: '数据格式三'},
      {value: 75,name: '数据格式四'},
      {value: 20,name: '数据格式五'}
  ];

  getArrByKey = (data, k) => {
      let key = k || 'value';
      let res = [];
      if (data) {
          data.forEach(function (t) {
              res.push(t[key]);
          });
      }
      return res;
  };
  getSymbolData = (data) => {
      let arr = [];
      for (var i = 0; i < data.length; i++) {
          arr.push({
              value: data[i].value,
              symbolPosition: 'end',
          });
      }
      return arr;
  };

  option = {
      backgroundColor:"",
      grid: {
          top:'2%',
          bottom:'2%',
          right:'2%',
          left:'2%',
          containLabel: true,
      },
      xAxis: {
          show: false,
      },
      yAxis: [
          {
              triggerEvent: true,
              show: true,
              inverse: true,
              data: getArrByKey(data, 'name'),
              axisLine: {
                  show: false,
              },
              splitLine: {
                  show: false,
              },
              axisTick: {
                  show: false,
              },
              axisLabel: {
                  interval: 0,
                  inside: true,
                  color: '#000',
                  margin:0,
                  padding: [0, 0, 15, 0],
                  align: 'left',
                  verticalAlign:'bottom',
                  formatter: function (value, index) {
                      return '{title|' + value + '}';
                  },
                  rich: {
                      title: {
                          width: 50,
                          fontSize: 14,
                      },
                  },
              },
          },
          {
              triggerEvent: true,
              show: true,
              inverse: true,
              data: getArrByKey(data, 'name'),
              axisLine: {
                  show: false,
              },
              splitLine: {
                  show: false,
              },
              axisTick: {
                  show: false,
              },
              axisLabel: {
                  margin: 0,
                  interval: 0,
                  inside: true,
                  padding: [0, 0, 15, 0],
                  color: '#000',
                  fontSize: 14,
                  align: 'right',
                  verticalAlign: 'bottom',
                  formatter: function (value, index) {
                      return data[index].value+"个";
                  },
              },
          },
      ],
      series: [
          {
              type: 'bar',
              showBackground: true,
              barMinWidth:'10',
              backgroundStyle: {
                  opacity: 1,
                  color: '#1f4365',
              },
              yAxisIndex: 0,
              data: data,
              barWidth: 20,
              // align: left,
              stack: "2",
              itemStyle: {
                  normal: {
                      //颜色渐变函数 前四个参数分别表示四个位置依次为左、下、右、上
                      color: new echarts.graphic.LinearGradient(0, 0, 1, 0, [
                          {
                              offset: 0,
                              color: "#00d5fc",
                          },
                          {
                              offset: 1,
                              color:  "#1280eb",
                          },
                      ]),
                  },
              }
          },
          {
              type: 'pictorialBar',
              symbol: 'rect',
              symbolSize: [4, 30],
              symbolOffset: [3, 0],
              zlevel: 13,
              barMinHeight:1,
              symbolPosition: 'end',
              itemStyle: {
                  normal: {
                      color: new echarts.graphic.LinearGradient(0, 1, 0, 0, [{
                          offset: 0,
                          color: '#FBDD9E'
                      }, {
                          offset: 1,
                          color: '#FFFFFF'
                      }]),
                      shadowBlur: 5,
                      shadowOffsetY: 2,
                      shadowColor: 'rgba(0, 0, 0, 0.72)'
                  }
              },
              data: data,
          },
      ],
};- 1.
- 2.
- 3.
- 4.
- 5.
- 6.
- 7.
- 8.
- 9.
- 10.
- 11.
- 12.
- 13.
- 14.
- 15.
- 16.
- 17.
- 18.
- 19.
- 20.
- 21.
- 22.
- 23.
- 24.
- 25.
- 26.
- 27.
- 28.
- 29.
- 30.
- 31.
- 32.
- 33.
- 34.
- 35.
- 36.
- 37.
- 38.
- 39.
- 40.
- 41.
- 42.
- 43.
- 44.
- 45.
- 46.
- 47.
- 48.
- 49.
- 50.
- 51.
- 52.
- 53.
- 54.
- 55.
- 56.
- 57.
- 58.
- 59.
- 60.
- 61.
- 62.
- 63.
- 64.
- 65.
- 66.
- 67.
- 68.
- 69.
- 70.
- 71.
- 72.
- 73.
- 74.
- 75.
- 76.
- 77.
- 78.
- 79.
- 80.
- 81.
- 82.
- 83.
- 84.
- 85.
- 86.
- 87.
- 88.
- 89.
- 90.
- 91.
- 92.
- 93.
- 94.
- 95.
- 96.
- 97.
- 98.
- 99.
- 100.
- 101.
- 102.
- 103.
- 104.
- 105.
- 106.
- 107.
- 108.
- 109.
- 110.
- 111.
- 112.
- 113.
- 114.
- 115.
- 116.
- 117.
- 118.
- 119.
- 120.
- 121.
- 122.
- 123.
- 124.
- 125.
- 126.
- 127.
- 128.
- 129.
- 130.
- 131.
- 132.
- 133.
- 134.
- 135.
- 136.
- 137.
- 138.
- 139.
- 140.
- 141.
- 142.
- 143.
- 144.
- 145.
- 146.
- 147.
- 148.
- 149.
- 150.
- 151.
- 152.
- 153.
- 154.
- 155.
- 156.
- 157.
- 158.
- 159.
- 160.
参考:
https://echarts.zhangmuchen.top/#/detail?cid=28ea6-0601-e9f5-9cc29-c022b758


 1174
1174

 被折叠的 条评论
为什么被折叠?


