


To visualize the distribution of the random numbers generated by the code you provided, you can write a program that generates a large number of random numbers using the same code and then plots a histogram of the results. This will allow you to see the shape of the distribution and compare it to a normal distribution.
Here’s an example of how you can do this using the C++ <random> library and the matplotlib library for plotting (in Python):
#include <iostream>
#include <random>
#include <vector>
using TYPE_SIZE = long long int;
int main(int argc, char **argv) {
    // Parse command line arguments
    TYPE_SIZE DB_SIZE = argc > 1 ? atoll(argv[1]) : 1; // unit: MB
    DB_SIZE *= 1024 * 1024; // unit: B
    TYPE_SIZE BLOCK_SIZE = argc > 2 ? atoll(argv[2]): 1; // unit: KB
    BLOCK_SIZE *= 1024; // unit: B
    TYPE_SIZE REALNUMBLOCKS = DB_SIZE % BLOCK_SIZE == 0 ? DB_SIZE / BLOCK_SIZE : DB_SIZE / BLOCK_SIZE + 1;

    // Generate random numbers
    std::vector<int> results;
    std::random_device rd;
    std::mt19937 gen(rd());
    std::normal_distribution<> dis(REALNUMBLOCKS / 2, REALNUMBLOCKS / 4);
    for (int i = 0; i < 10000; i++) {
        int randIndex = static_cast<int>(dis(gen));
        randIndex = std::max(0, static_cast<int>(randIndex));
        randIndex = std::min(static_cast<int>(REALNUMBLOCKS - 1), static_cast<int>(randIndex));
        results.push_back(randIndex);
    }

    // Print results
    for (int result : results) {
        std::cout << result << std::endl;
    }

    return 0;
}
This code generates 10000 random numbers using the same code you provided and stores them in a std::vector. It then prints the results to standard output.
You can compile and run this code using a command like this:
g++ -std=c++11 random_numbers.cpp -o random_numbers
./random_numbers > random_numbers.txt
This will generate a file named random_numbers.txt that contains the generated random numbers.
Next, you can use Python and matplotlib to plot a histogram of the results:
import matplotlib.pyplot as plt

# Load data from file
with open('random_numbers.txt', 'r') as f:
    data = [int(line.strip()) for line in f]

# Plot histogram
plt.hist(data, bins=50)
plt.show()
This code reads the data from the random_numbers.txt file and uses plt.hist to plot a histogram of the results. You can adjust the bins parameter to change the number of bins in the histogram.
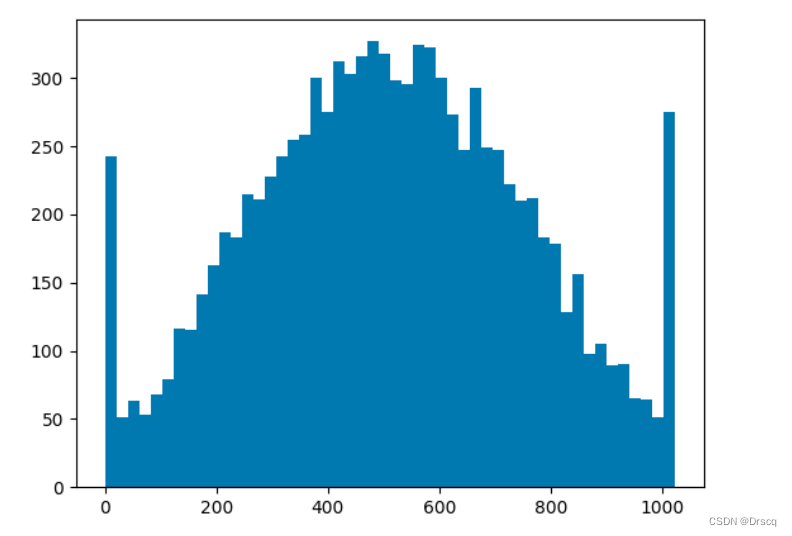
When you run this code, it will display a window with a plot of the histogram. You can visually inspect the shape of the distribution and compare it to a normal distribution.
The Final Results:
I hope this helps! Let me know if you have any further questions.


 1万+
1万+


 被折叠的 条评论
为什么被折叠?
被折叠的 条评论
为什么被折叠?
 到【灌水乐园】发言


