


文献速递:多模态影像组学文献分享:(一种诊断方法结合了多模态放射组学和基于腰椎CT及X光的机器学习模型,用于骨质疏松症)**
Title
题目
A diagnostic approach integrated multimodal radiomics with machine learning models based on lumbar spine CT and X‑ray for osteoporosis
一种诊断方法结合了多模态放射组学和基于腰椎CT及X光的机器学习模型,用于骨质疏松症
Abstract-Background
摘要-背景
The aim of this analysis is to construct a combined model that integrates radiomics, clinical risk factors, andmachine learning algorithms to diagnose osteoporosis in patients and explore its potential in clinical applications
本分析的目标是构建一个综合模型,该模型结合了放射组学、临床风险因素和机器学习算法,用于诊断患者的骨质疏松症,并探索其在临床应用中的潜力。
Methods
方法
A retrospective analysis was conducted on 616 lumbar spine. Radiomics features were extracted from
the computed tomography (CT) scans and anteroposterior and lateral X-ray images of the lumbar spine. Logistic regression(LR), support vector machine (SVM), and random forest (RF) algorithms were used to construct radiomics models. Thereceiver operating characteristic curve (ROC) was employed to select the best-performing model. Clinical risk factors were identifed through univariate logistic regression analysis (ULRA) and multivariate logistic regression analysis (MLRA) andutilized to develop a clinical model. A combined model was then created by merging radiomics and clinical risk factors.
The performance of the models was evaluated using ROC curve analysis, and the clinical value of the models was assessed using decision curve analysis (DCA).
对616个腰椎进行了回顾性分析。从腰椎的计算机断层扫描(CT)和前后位及侧位X光影像中提取放射组学特征。使用逻辑回归(LR)、支持向量机(SVM)和随机森林(RF)算法构建放射组学模型。接收者操作特征曲线(ROC)用于选择性能最佳的模型。通过单变量逻辑回归分析(ULRA)和多变量逻辑回归分析(MLRA)确定临床风险因素,并用于开发临床模型。然后通过合并放射组学和临床风险因素创建综合模型。使用ROC曲线分析评估模型的性能,并通过决策曲线分析(DCA)评估模型的临床价值
Results
结果
A total of 4858 radiomics features were extracted. Among the radiomics models, the SVM model demonstrated theoptimal diagnostic capabilities and accuracy, with an area under the curve (AUC) of 0.958 (0.9405–0.9762) in the train
ing cohort and 0.907 (0.8648–0.9492) in the test cohort. Furthermore, the combined model exhibited an AUC of 0.959(0.9412–0.9763) in the training cohort and 0.910 (0.8690–0.9506) in the test cohort.
提取了总共4858个放射组学特征。在放射组学模型中,支持向量机(SVM)模型显示出最优的诊断能力和准确性,在训练队列中的曲线下面积(AUC)为0.958(0.9405–0.9762),在测试队列中为0.907(0.8648–0.9492)。此外,综合模型在训练队列中的AUC为0.959(0.9412–0.9763),在测试队列中为0.910(0.8690–0.9506)。
Conclusions
结论
The combined model displayed outstanding ability in diagnosing osteoporosis, providing a safe and efcient
method for clinical decision-making.
综合模型在诊断骨质疏松症方面展现出卓越的能力,为临床决策提供了一种安全高效的方法。
Figure
图

Fig. 1 Flowchart for selecting the study population. ROI,region of interest
图 1 研究人群选择流程图。ROI,感兴趣区域
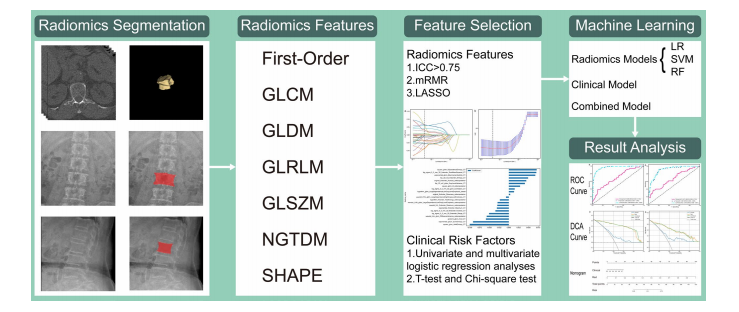
Fig. 2 Workfow of this study. GLCM, gray-level co-occurrencematrix; GLDM gray-level dependence matrix; GLRLM gray-level runlength matrix; GLSZM gray-level size zone matrix; NGTDM neigh
borhood gray-tone diference matrix; SHAPE shape-based features;ICC intraclass correlation coefcient; mRMR minimum redundancymaximum relevance; LASSO, least absolute shrinkage and selec
tion operator; LR logistic regression; SVM support vector machine;RF random forest; ROC receiver operating characteristic curve; DCAdecision curve analysis
图 2 本研究的工作流程。GLCM,灰度共生矩阵;GLDM 灰度依赖矩阵;GLRLM 灰度游程长度矩阵;GLSZM 灰度大小区域矩阵;NGTDM 邻域灰度差异矩阵;SHAPE 基于形状的特征;ICC 类内相关系数;mRMR 最小冗余最大相关性;LASSO,最小绝对收缩和选择算子;LR 逻辑回归;SVM 支持向量机;RF 随机森林;ROC 接收者操作特征曲线;DCA 决策曲线分析。
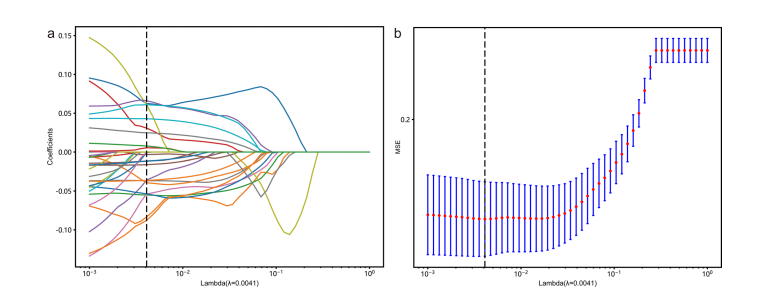
Fig. 3 a LASSO coefcient profle plot with diferent log (λ) wasshown. The vertical dashed lines represent 21 radiomics features with**nonzero coefcients selected with the optimal Lambda value. b Themost valuable features were screened out by tuning Lambda usingLASSO via minimum binomial deviation. LASSO, least absolute shrinkage and selection operator
图 3 a 展示了具有不同对数 (λ) 的LASSO系数轮廓图。垂直虚线代表通过最优Lambda值选出的21个非零系数的放射组学特征。b 通过使用LASSO调整Lambda值,根据最小二项偏差筛选出最有价值的特征。LASSO,最小绝对收缩和选择算子。
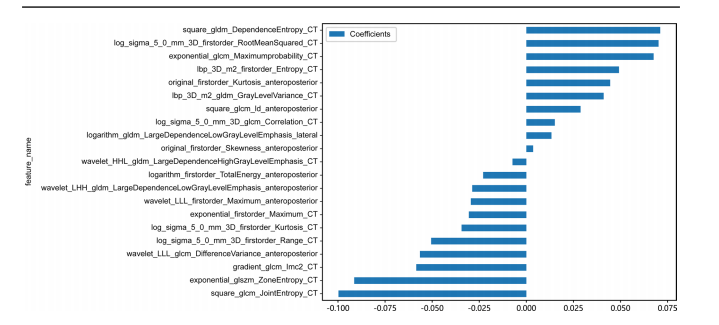
Fig. 4 The 21 optimal radiomic features selected for the radiomics model are shown in this image, illustrating the contribution of each feature in
the radiomics model
图 4 此图显示了为放射组学模型选择的21个最佳放射组学特征,展示了每个特征在放射组学模型中的贡献
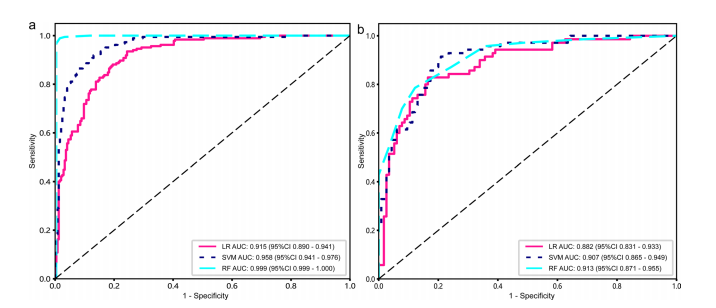
Fig. 5 The receiver operating characteristic curves for the radiomics models (LR, SVM, RF) in the training (a) and test (b) cohorts are shown. The y-axis represents the true positive rate (sensitivity), and
the x-axis represents the false positive rate (1-specifcity). The diago nal line represents the performance of a random classifer. LR logis
tic regression; SVM support vector machine; RF random forest; AUCarea under the curve
图 5 展示了训练组(a)和测试组(b)中放射组学模型(LR、SVM、RF)的接收者操作特征曲线。y轴代表真阳性率(敏感性),x轴代表假阳性率(1-特异性)。对角线代表随机分类器的性能。LR 逻辑回归;SVM 支持向量机;RF 随机森林;AUC 曲线下面积。
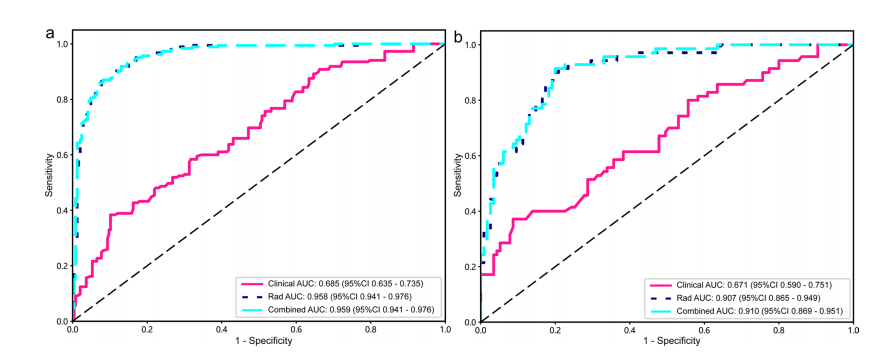
Fig. 6 The receiver operating characteristic curves of the clini cal, radiomics, and combined models in the training (a) and test (b)cohorts are displayed. It is plotted with the true positive rate (sensi tivity) on the y-axis against the false positive rate (1-specifcity) on
the x-axis. The diagonal line represents the performance of a random classifer. Rad radiomics model (SVM); AUC area under the curve
图 6 展示了临床、放射组学和综合模型在训练组(a)和测试组(b)中的接收者操作特征曲线。图中以真阳性率(敏感性)为y轴,假阳性率(1-特异性)为x轴绘制。对角线代表随机分类器的性能。Rad 放射组学模型(SVM);AUC 曲线下面积。
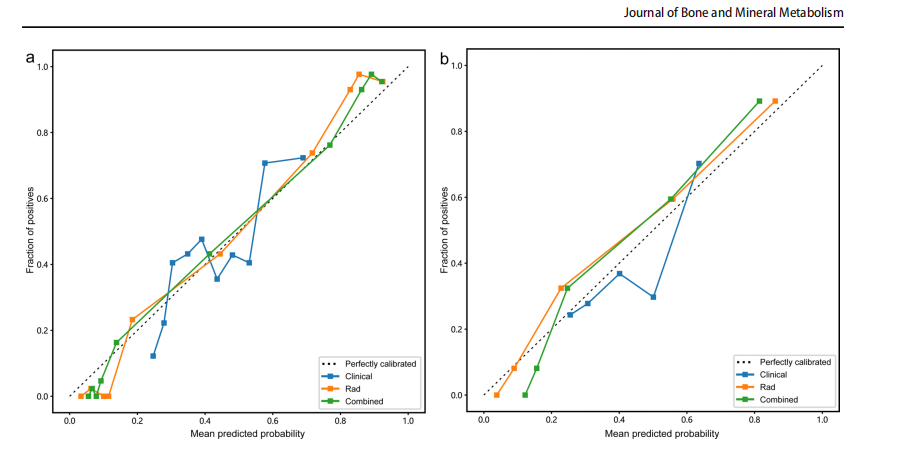
Fig. 7 The combined model calibration curve in the training (a) andtest (b) cohort, illustrating the relationship between Mean Predicted
Probability on the x-axis and Fraction of Positive on the y-axis, while comparing their alignment with the perfectly calibrated line. Rad,radiomics model (SVM)
图 7 在训练(a)和测试(b)队列中结合模型校准曲线,展示了x轴上的平均预测概率与y轴上的阳性比例之间的关系,同时比较它们与完美校准线的对齐情况。Rad为放射组学模型(SVM)。
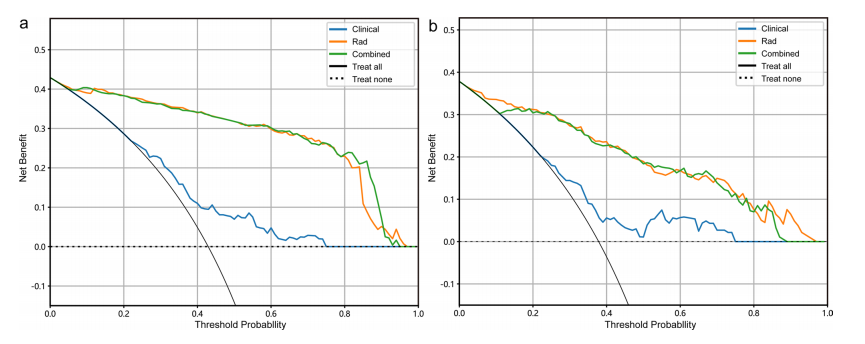
Fig. 8 Decision curve analysis of the clinical, radiomics, and combined models in the training (a) and test (b) cohort. The y-axis indicates the net beneft; the x-axis indicates threshold probability. Rad, radiomics model (SVM)
图 8 在训练(a)和测试(b)队列中临床、放射组学和结合模型的决策曲线分析。y轴表示净效益;x轴表示阈值概率。Rad为放射组学模型(SVM)。
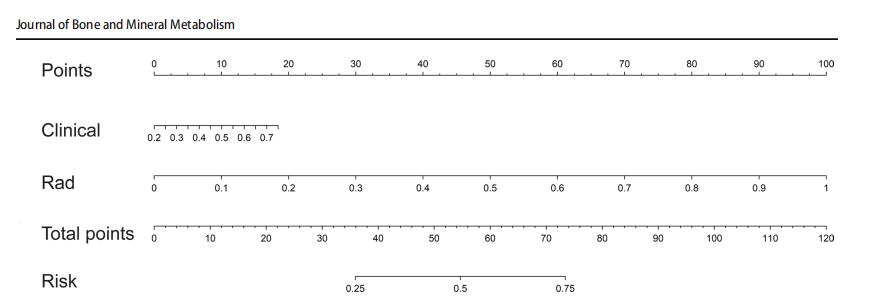
Fig. 9 The nomogram of the combined model. The second row represents scores of clinical indicators, and the third row indicates scores
of radiomics features. Draw a vertical line on the frst row to obtainthe corresponding score. The cumulative score of the two features isrefected in the fourth row, while the likelihood of diagnosing osteo
porosis is determined in the ffth row. Rad radiomics model (SVM);clinical, clinical model (SVM)
图 9 结合模型的列线图。第二行表示临床指标的得分,第三行表示放射组学特征的得分。在第一行上画一条垂直线来获取相应的得分。两个特征的累积得分反映在第四行,而第五行决定了诊断骨质疏松症的可能性。Rad为放射组学模型(SVM);临床为临床模型(SVM)。
Table
表
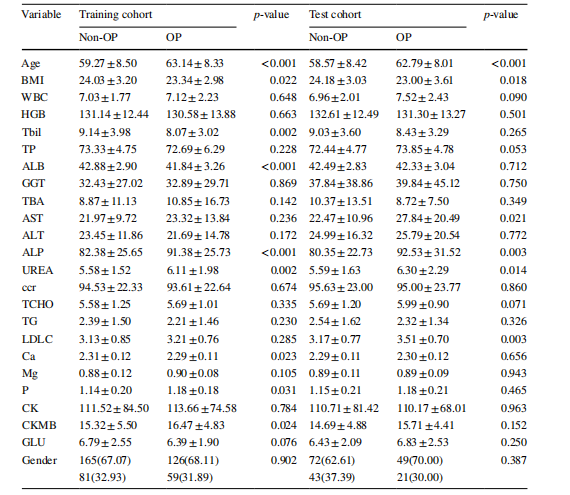
Table 1 The diferences of clinical data between the osteoporosis group and nonosteoporosis group in both the training and test cohorts
表 1 训练组和测试组中骨质疏松症组与非骨质疏松症组之间的临床数据差异
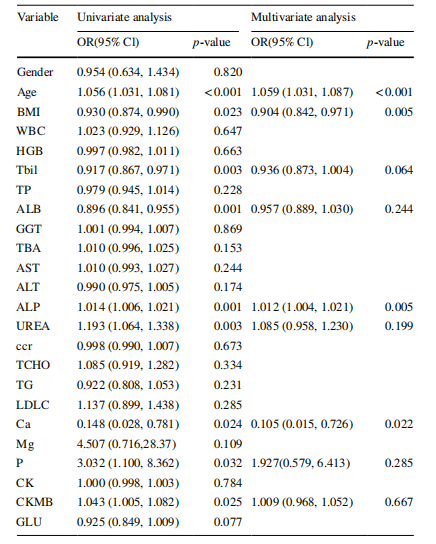
Table 2 Univariate and multivariable logistic regression analyses for selecting clinical data of model development
表 2 用于选择模型开发临床数据的单变量和多变量逻辑回归分析
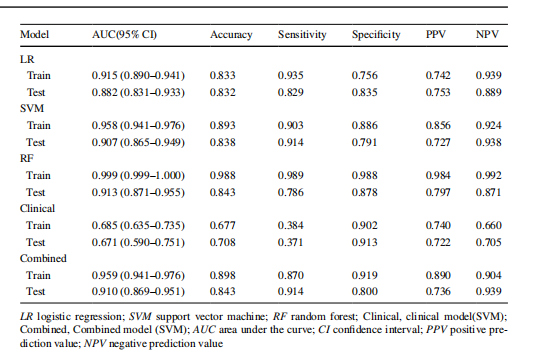
Table 3 Diagnostic performance of diferent models
for predicting osteoporosis in training and test cohorts
表 3 不同模型在训练和测试组中预测骨质疏松症的诊断性能


 1693
1693

 被折叠的 条评论
为什么被折叠?
被折叠的 条评论
为什么被折叠?
 到【灌水乐园】发言


