


文献速递:人工智能医学影像分割— PSMA-PET 提升了基于深度学习的自动化CT肾脏分割技术
01
文献速递介绍
最近的研究表明,使用177Lu标记的前列腺特异性膜抗原(PSMA)的放射性药物治疗(RPT)对于治疗去势抵抗性前列腺癌是有益的。为了实现最佳治疗效果,关键是在治疗过程中向肿瘤提供尽可能高的吸收剂量,同时保护健康组织免受毒性影响。与RPT中许多其他典型的风险器官不同,膀胱、颌下腺和腮腺以及肾脏表现出对PSMA的增加积聚,因此暴露于更高的吸收剂量,因此被认为是可能导致治疗限制的风险器官。因此,基于PSMA的RPT涉及肾脏毒性的风险,建议估计治疗周期中的肾脏吸收剂量和实际累积的肾脏吸收剂量。可用177Lu-PSMA SPECT/CT进行肾脏剂量学,这需要确定肾脏的位置、大小和形状。尽管可以使用MRI等不同的形态成像方式,但这些形态参数通常是从CT图像中确定的,这些图像通常是RPT规划所必需的。虽然如果操作者受过充分培训和经验丰富,手动分割可能是最准确的方法,但它的主要缺点是耗时且即使对同一肾脏的分割也可能导致显著的观察者间和观察者内变异。为了缓解这些问题,近年来提出了许多使用自动技术(如基于可变形模型或基于图谱的分割)进行分割的努力。随着机器学习的最近成功,卷积神经网络(CNNs)已被证明对基于CT的肾脏分割具有巨大潜力。尽管已经开发了各种基于CT的自动肾脏分割,但它们都仅基于形态信息。在这项工作中,我们的想法是通过包含来自PSMA-PET的功能信息来增强这些基于形态的分割。这有望减少中提出的问题,因为囊肿可以在PSMA-PET图像中轻松检测到,因为摄取量减少。此外,肾脏、肝脏和脾脏中不同的活动浓度提供了区分这些器官的额外手段,这反过来可能会显著改善仅基于CT的自动肾脏分割。在这项研究中,使用108个手动分割的基于PSMA的PET/CT扫描的数据集来训练不同的CNNs进行自动肾脏分割。应用了不同的方法来利用自动分割过程中的PET信息。最后,由一位经验丰富的核医学医师对100名额外患者的自动分割(包括和不包括PET信息)进行了视觉评估。
Title
题目
PSMA-PET improves deep learning-based automated CT kidney segmentation
PSMA-PET 提升了基于深度学习的自动化CT肾脏分割技术
Abstract
摘要
For dosimetry of radiopharmaceutical therapies, it is essential to determine the volume of relevant structures exposed to therapeutic radiation. For many radiopharmaceuticals, the kidneys represent an important organ-at-risk. To reduce the time required for kidney segmentation, which is often still performed manually, numerous approaches have been presented in recent years to apply deep learning-based methods for CT-based automated segmentation. While the automatic segmentation methods presented so far have been based solely on CT information, the aim of this work is to examine the added value of incorporating PSMA-PET data in the automatic kidney segmentation.
对于影像性药物治疗的剂量学,确定暴露于治疗性影像线的相关结构的体积至关重要。对于许多放射性药物,肾脏是一个重要的风险器官。为了减少肾脏分割所需的时间,这通常仍然是手动进行的,近年来已经提出了许多方法应用基于深度学习的方法进行基于CT的自动化分割。虽然到目前为止所呈现的自动分割方法仅基于CT信息,但本工作的目的是检验结合PSMA-PET数据在自动肾脏分割中的附加价值。
Methods
方法
A total of 108 PET/CT examinations (53 [68Ga]Ga-PSMA-I&T and 55 [18F]F-PSMA-1007 examinations) were grouped to create a reference data set of manual segmentations of the kidney. These segmentations were performed by a human examiner. For each subject, two segmentations were carried out: one CT-based (detailed) segmentation and one PET-based (coarser) segmentation. Five different u-net based approaches were applied to the data set to perform an automated segmentation of the kidney: CT images only, PET images only (coarse segmentation), a combination of CT and PET images, a combination of CT images and a PET-based coarse mask, and a CT image, which had been presegmented using a PET-based coarse mask. A quantitative assessment of these approaches was performed based on a test data set of 20 patients, including Dice score, volume deviation and average Hausdorff distance between automated and manual segmentations. Additionally, a visual evaluation of automated segmentations for 100 additional (i.e., exclusively automatically segmented) patients was performed by a nuclear physician. Results: Out of all approaches, the best results were achieved by using CT images which had been pre-segmented using a PET-based coarse mask as input. In addition, this method performed significantly better than the segmentation based solely on CT, which was supported by the visual examination of the additional segmentations. In 80% of the cases, the segmentations created by exploiting the PET-based pre-segmentation were preferred by the nuclear physician.
共有108例PET/CT检查(53例[68Ga]Ga-PSMA-I&T和55例[18F]F-PSMA-1007检查)被分组,创建了肾脏手动分割的参考数据集。这些分割由人类检查员执行。对于每个受试者,进行了两次分割:一次基于CT的(详细)分割和一次基于PET的(粗略)分割。五种不同的基于U-Net的方法被应用于数据集,以执行肾脏的自动化分割:仅CT图像、仅PET图像(粗略分割)、CT和PET图像的组合、CT图像和基于PET的粗略掩模的组合,以及使用基于PET的粗略掩模预分割的CT图像。基于20名患者的测试数据集对这些方法进行了定量评估,包括Dice分数、体积偏差和自动化与手动分割之间的平均Hausdorff距离。此外,由核医学医师对100名额外患者(即,仅自动分割的患者)的自动化分割进行了视觉评估。结果:在所有方法中,使用基于PET的粗略掩模预分割的CT图像作为输入取得了最佳结果。此外,这种方法的表现显著优于仅基于CT的分割,这一点通过对额外分割的视觉检查得到了支持。在80%的情况下,核医学医师更倾向于使用基于PET的预分割创建的分割。
Conclusions
结论
This study shows that deep-learning based kidney segmentation can be significantly improved through the addition of a PET-based pre-segmentation. The presented method was shown to be especially beneficial for kidneys with cysts or kidneys that are closely adjacent to other organs such as the spleen, liver or pancreas. In the future, this could lead to a considerable reduction in the time required for dosimetry calculations as well as an improvement in the results.
这项研究表明,通过添加基于PET的预分割,基于深度学习的肾脏分割可以得到显著改善。特别是对于带有囊肿的肾脏或与脾脏、肝脏或胰腺等其他器官紧密相邻的肾脏,这种方法被证明特别有益。在未来,这可能会显著减少放射剂量学计算所需的时间,并改善结果。
Figure
图
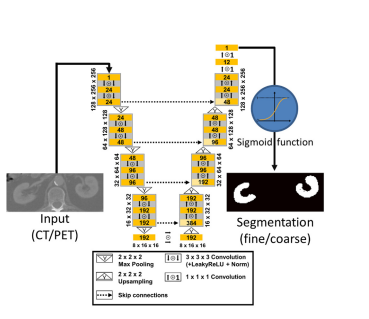
Figure 1. Architecture of the u-net used in this study.
图 1. 本研究中使用的U-Net架构。
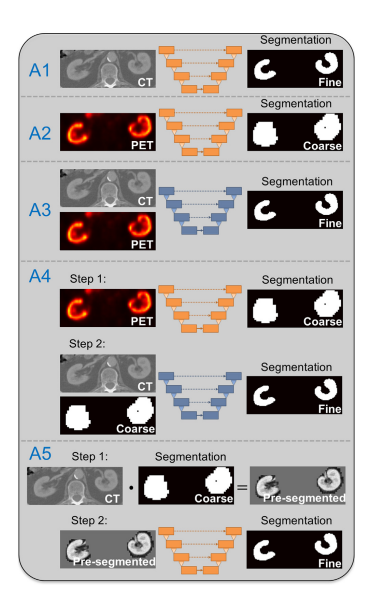
Figure 2. Schematic overview of u-net based kidney segmentation approaches applied in this work. While approaches A1 and A2 perform simple end-to-end training from image to segmentation, approaches A3 to A5 exploit information from both imaging modalities. The u-nets for approach A3 and A4 (step 2) use a twochannel input (orange u-net: one-channel input, blue u-net: twochannel input).
图 2. 本工作中应用的基于U-Net的肾脏分割方法的示意性概述。虽然方法A1和A2执行从图像到分割的简单端到端训练,但方法A3到A5利用来自两种成像方式的信息。方法A3和A4的U-Net(第二步)使用两通道输入(橙色U-Net:单通道输入,蓝色U-Net:两通道输入)。
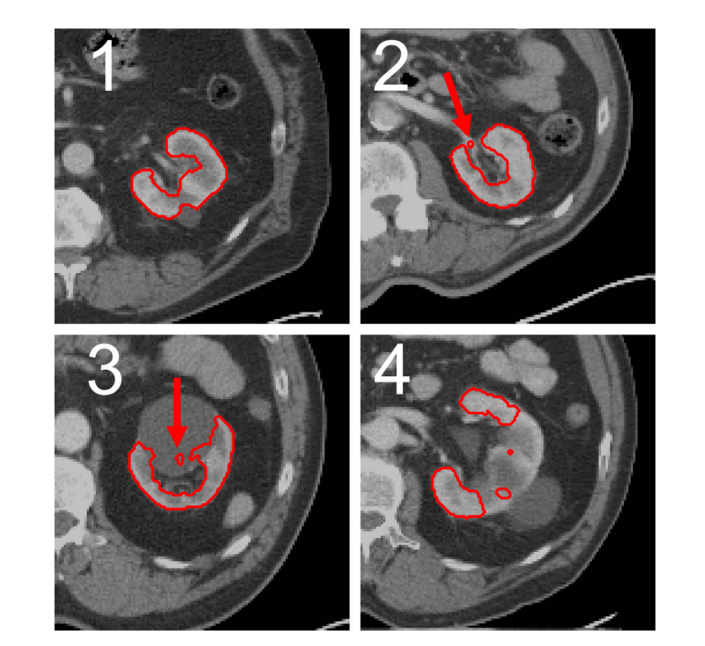
Figure 3. Exemplary representation of automatically generated segmentation of the four scoring values. All segmentations were created solely based on CT using approach A1. For the segmentation, which was rated with a score of 1 (upper left, image 1), no errors are recognizable. For the kidney on the top right (image 2) a small part of the renal hilus was segmented incorrectly (indicated by the red arrow), resulting in a score of 2. Bottom left (image 3) a segmentation containing parts of a cyst is shown (indicated by red arrow), resulting in a score of 3. For the segmentation (lower right, image 4), which was rated with a score of 4, rough errors are visible, as large parts of the kidney are not segmented.
图 3. 四种评分值的自动生成分割的示例性表示。所有分割仅基于使用方法A1的CT创建。对于评分为1的分割(左上角,图像1),无法识别出错误。对于右上方的肾脏(图像2),肾门的一小部分被错误分割(由红色箭头指示),因此评分为2。左下角(图像3)显示了包含囊肿部分的分割(由红色箭头指示),因此评分为3。对于评分为4的分割(右下角,图像4),可以看到粗略的错误,因为大部分肾脏未被分割。
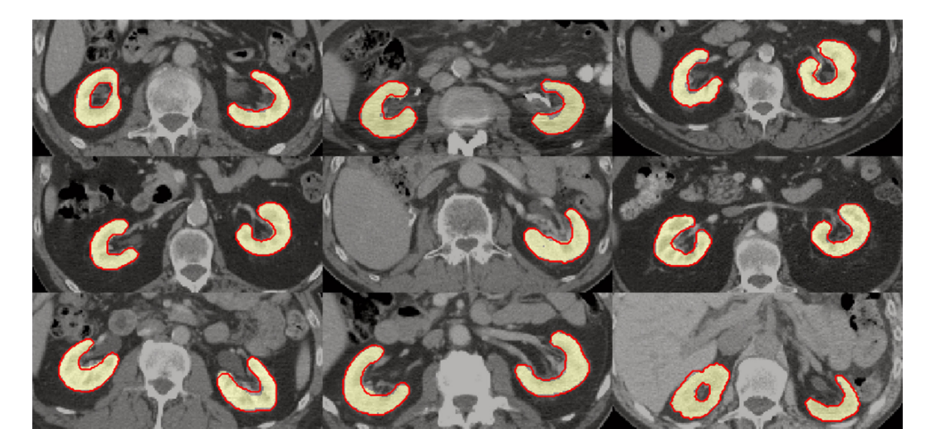
Figure 4. Example segmentations for nine patients of the test data set. Yellow area: manual segmentation. Red contour: automated segmentation created by approach A5.
图 4. 测试数据集中九名患者的示例分割。黄色区域:手动分割。红色轮廓:使用方法A5创建的自动分割。
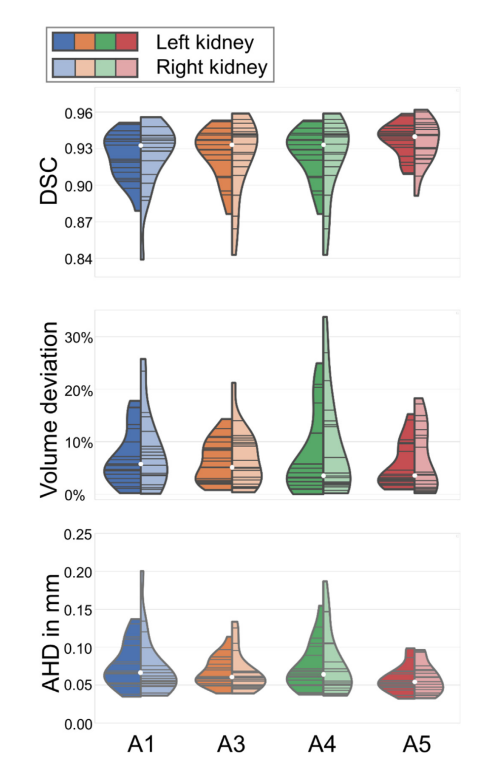
Figure 5. Violin plots illustrating the performance of approaches A1, A3, A4, and A5 for all evaluation metrics (top to bottom: Dice score (DSC), volume deviation, and (AHD) average Hausdorff distance) separately for left and right kidney (left and right part of each violin). The white dot represents the median and the gray lines illustrate the data points. The segmentation method is better the closer the DSC value is to 1 or the VD and AHD values are to zero.
图 5. 小提琴图展示了方法A1、A3、A4和A5在所有评估指标上的表现(从上到下分别是:Dice分数(DSC)、体积偏差和平均Hausdorff距离(AHD)),分别针对左肾和右肾(每个小提琴的左右部分)。白色点代表中位数,灰色线条展示了数据点。分割方法越好,DSC值越接近1或VD和AHD值越接近零。
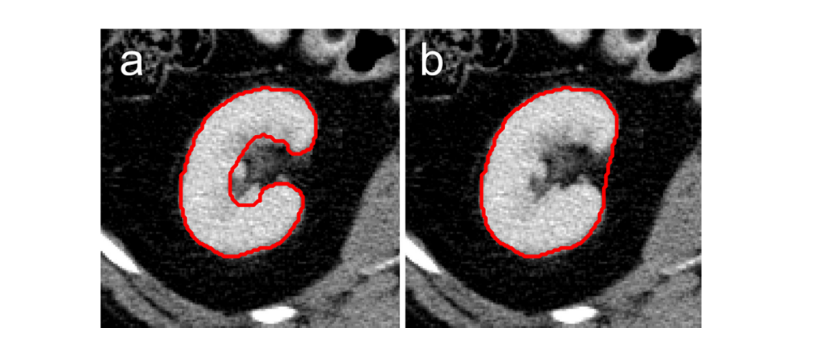
Figure 6. Illustration of different levels of accuracy of renal segmentations. a: more detailed segmentations as performed in this study, excluding the renal pelvis and vessels. b: coarser segmentation as performed in
图 6. 肾脏分割准确度不同水平的示意图。a:本研究中进行的更详细的分割,不包括肾盂和血管。b:本研究中进行的较粗糙的分割。
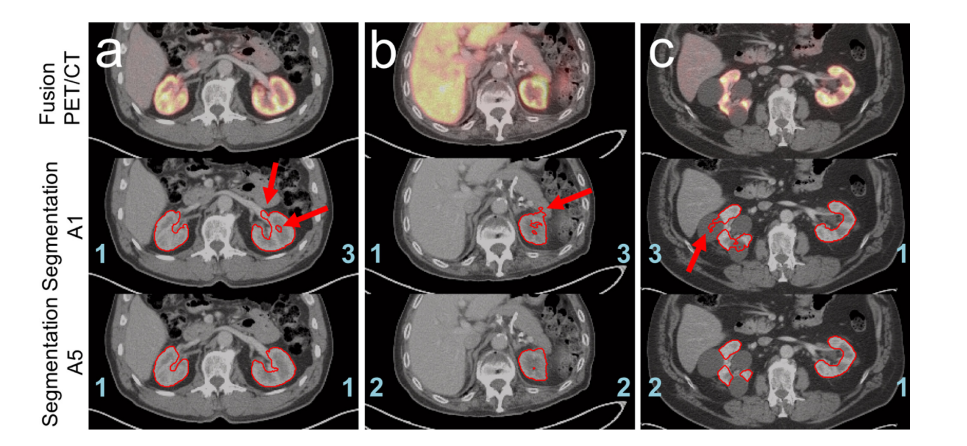
Figure 7. Examples highlighting the benefits of the pre-segmentation approach A5. PET/CT fusion (top), CT with the contour of the segmentation created by A1 (middle), and CT with contour of the segmentation created by A5 (bottom) are depicted for three different patients from the visual evaluation data. The assigned scores for the segmentation are indicated in blue and the mentioned artifacts are highlighted by red arrows: a: too much of the left renal hilus is segmented by approach A1. In addition, a hole in the left kidney marrow is visible. The segmentation using approach A5, on the other hand, does not show these inadequacies. b: both segmentations recognize that the right kidney is missing. However, part of the pancreas is included in the A1 segmentation. This artifact does not occur for the presegmentation method A5. c: patient with large cysts in the right kidney. Approach A1 exhibits major problems in distinguishing between renal tissue and cysts, thus large sections of the cysts are misclassified. In contrast, the pre-segmentation approach A5 is significantly more effective at segmenting the kidney tissue excluding the cysts.
图 7. 突出显示预分割方法A5优势的示例。三名不同患者的视觉评估数据的PET/CT融合图(顶部)、用方法A1创建的分割轮廓的CT(中部)以及用方法A5创建的分割轮廓的CT(底部)分别展示。分割的分数用蓝色标记,提到的伪影由红色箭头高亮显示:a:方法A1分割了过多的左肾门部分。此外,左肾髓质中可见一个洞。相比之下,使用方法A5的分割则没有这些不足。b:两种分割都认识到右肾缺失。然而,方法A1的分割包括了部分胰腺。这种伪影在预分割方法A5中不会出现。c:患者右肾有大型囊肿。方法A1在区分肾脏组织和囊肿方面存在重大问题,因此大部分囊肿被错误分类。相比之下,预分割方法A5在分割肾脏组织排除囊肿方面明显更有效。
Table
表
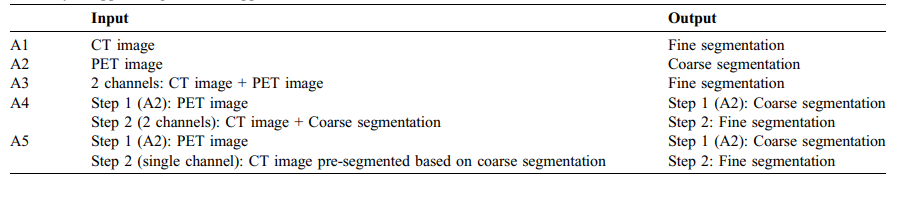
Table 1 Summary of applied segmentation approaches A1 to A5.
表 1 应用的分割方法A1至A5的总结。
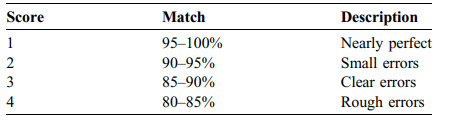
TABLE 2 Classification of the scoring values for the visual evaluation of the segmentations.
表 2 分割视觉评估得分值的分类。
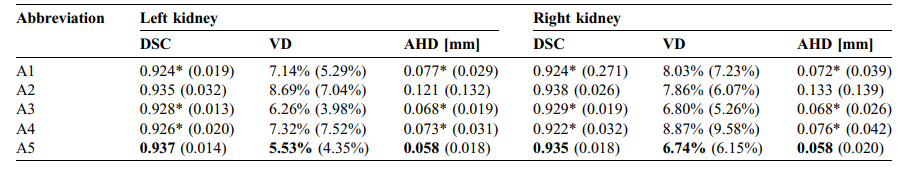
TABLE 3 Mean Dice score (DSC), volume deviation and average Hausdorff distance (AHD) between manual and automatic segmentations. Standard deviations are given in parentheses. The best scores for all metrics are written bold (except PET segmentation A2). Significant differences between approaches A1, A3 and A4 and approach A5 were marked for all three metrics ().
表3手动与自动分割之间的平均Dice分数(DSC)、体积偏差和平均Hausdorff距离(AHD)。标准偏差以括号表示。所有指标的最佳分数都用粗体标出(PET分割A2除外)。方法A1、A3和A4与方法A5之间在所有三个指标上的显著差异均已标记()。
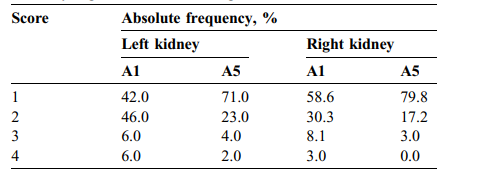
TABLE 4 Absolute frequency of visual scores assigned to the 100 nonmanually segmented automatic segmentations
表 4 分配给100个非手动分割的自动分割的视觉评分的绝对频率


 616
616


 被折叠的 条评论
为什么被折叠?
被折叠的 条评论
为什么被折叠?
 到【灌水乐园】发言


