


top > topinfo.txt
python 处理指定的统计信息并给出动态图,用于Linux系统debug
eg:处理cpu usage信息:
# -*- coding: gb2312 -*-

import matplotlib.pyplot as plt

filename = "./top.csv"
# 通过关键词项 确定需要提取处理的信息
key_words = ["CPU usage", "user", "sys"]


# 处理top信息
def deal_with_top_info(top_info_file):
    """输入:top >> top.txt文件
       输出:cpu使用率随时间变化表
    """
    try:
        fd = open(top_info_file, 'r', encoding='gbk')
        cpu_usage = []
        line = fd.readline()
        while line:
            if "CPU usage" in line:
                # 去除%号 后进行分词 取出CPU usage信息组成列表
                cpu_usage.append(float(line.replace('%', '').split()[2]))
            line = fd.readline()

        print(cpu_usage)

        plt.plot(range(0, len(cpu_usage)), cpu_usage)
        # plt.ylabel("CPU Usage")
        plt.show()

    except(FileNotFoundError, IOError):
        print("Fail to open top file")
        fd.close()
    finally:
        print("Top info handle Over")
        fd.close()


def handle_file_init():
    deal_with_top_info(filename)


if __name__ == "__main__":
    handle_file_init()
效果: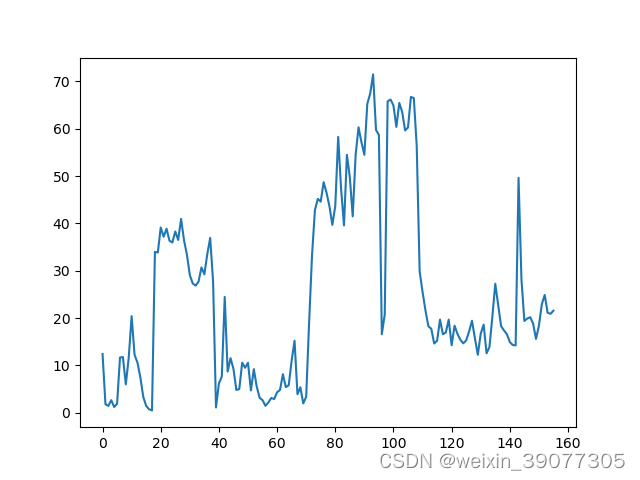
需要注意的是:使用matplot画图不能使用字符串数据 一定要数字化,否则画出来的图曲线是变形的


 2923
2923


 被折叠的 条评论
为什么被折叠?
被折叠的 条评论
为什么被折叠?
 到【灌水乐园】发言


