


1.datetime
2.date_range
3.set_index
4.resample
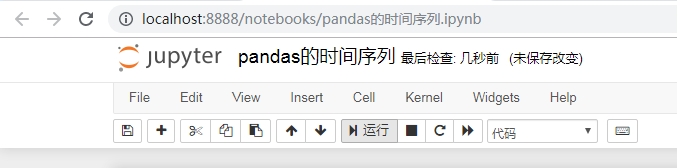
1.启动jupyter notebook
2.创建一个新的notebook
一 : time
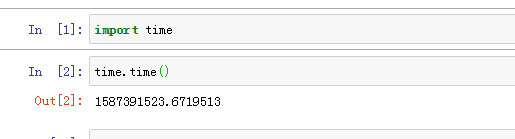
1.导入time 模块: import time
2.输出一个时间戳,为1970年到当前时间所经历的秒数: time.time()
3.将时间戳转化为可阅读形式:time.localtime(1587391523)

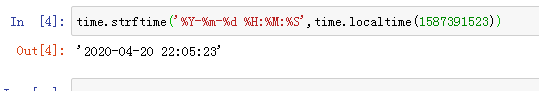
4.转化为固定格式字符串:
time.strftime('%Y-%m-%d %H:%M:%S',time.localtime(1587391523))
5.字符串转化为结构化的日期
local = time.strptime('2020-04-20 10:13','%Y-%m-%d %H:%M')
local

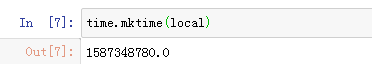
6.转化为时间戳
time.mktime(local)
二 : datetime
1.导入datetime模块: from datetime import datetime

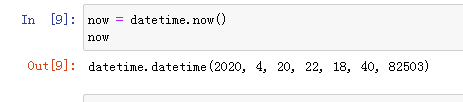
2.获取当前时间: now = datetime.now()
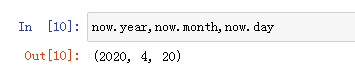
3.分别取出年月日: now.year , now.month , now.day
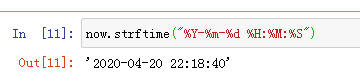
4.日期格式对象转化为固定字符串格式: now.strftime("%Y-%m-%d %H:%M:%S")
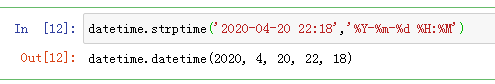
5.字符转转化为固定格式对象: datetime.strptime(‘2020-04-20 22:18’,’%Y-%m-%d %H:%M’)
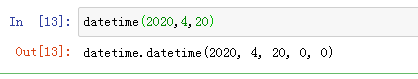
6.自己构建一个日期格式对象:datetime(2020,4,20)
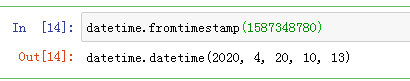
7.时间戳转化为一个时间格式对象:datetime.fromtimestamp(1587348780)
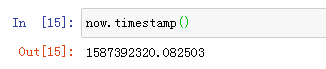
8.日期时间对象,转化为一个时间戳: now.timestamp()
三 : timedelta(时间间隔)
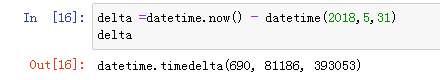
1.获取两个时间的时间间隔对象: delta =datetime.now() - datetime(2018,5,31)
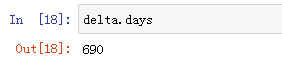
2.获取两个时间相隔的天数: delta.days
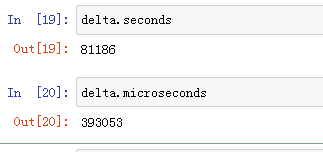
3.获取两个时间相隔的秒数和毫秒数
#秒数
delta.seconds
#毫秒数
delta.microseconds
四 : date_range()
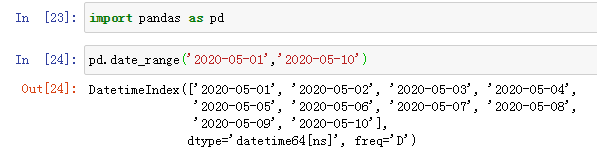
1.导入pandas
import pandas as pd
2.pd.date_range(‘2020-05-01’,‘2020-05-10’),得到10个日期值,默认采用频率是以天为单位,freq=‘D’
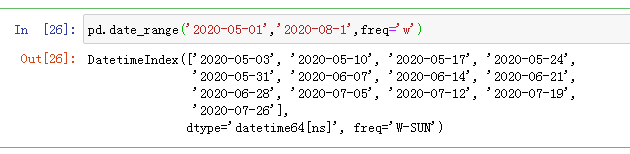
3.以周为单位采取时间:pd.date_range(‘2020-05-01’,‘2020-08-1’,freq=‘w’)
4.以月为单位采取时间:pd.date_range(‘2020-05-01’,‘2020-08-01’,freq=‘M’)

5.以季度为单位采取时间,pd.date_range(‘2020-05-01’,‘2020-10-01’,freq=‘Q’)

freq = 'H’表示小时,freq = 'T’表示分,freq = 'S’表示秒,freq = 'A’表示年
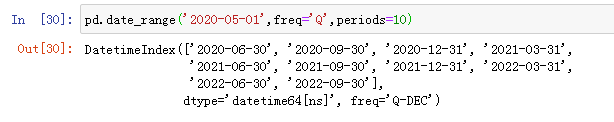
6.以季度为周期,返回10个日期:pd.date_range(‘2020-05-01’,freq=‘Q’,periods=10)
五 : set_index()
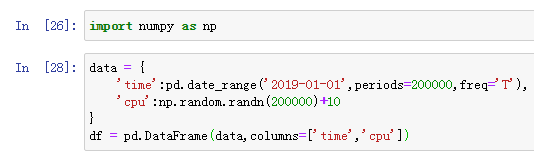
1.构建一个数据,每分钟采集cpu的使用率,采集200000次
#1.导入numpy
import numpy as np
#2.创建一个df
data = {
    'time':pd.date_range('2019-01-01',periods=200000,freq='T'),
    'cpu':np.random.randn(200000)+10
}
df = pd.DataFrame(data,columns=['time','cpu'])
2.获取前5条数据:df.head()

3.获取最后5条数据,df.tail()

4.取出某一个时间段的CPU占比,比如:df[(df.time>‘2019-01-01 06:00:00’) & (df.time<‘2019-01-01 06:10:00’) ]

5.将time设置成索引:
df2 = df.set_index('time')
df2.head()

6.设置时间序列还可以用: s = pd.to_datetime(df.time)

将s设置成df的时间序列
df.index=s
df.head()

删除原来的time那列
df = df.drop('time',axis=1)
df.head()

7.有了时间序列,直接通过切片的方式取出某段时间CPU的使用率:df[‘2019-01-01 06:00:00’:‘2019-01-01 06:05:00’]

如果值给了一个起始日期,会取出当天所有数据.
df2 = df['2019-01-01']
df2.head()
df2.tail()


8.对索引以天进行分组,求出每天的平均值
df2 = df.groupby(df.index.date).mean()
print(df2.head())
print(df2.tail())

9.对索引以小时进行分组,求平均值
df2 = df.groupby(df.index.hour).mean()
print(df2.head())
print(df2.tail())

10.对索引以周进行分组,求平均值
df2 = df.groupby(df.index.week).mean()
print(df2.head())
print(df2.tail())

六 : resample()重新取样
1.开始以每分钟进行采用,现在改成每一分半钟进行采样:df2 = df.resample(‘90S’).mean()

2.五分钟进行一次采样,将求平均值改成求最大值:df2 = df.resample(‘5T’).max()


 545
545


 被折叠的 条评论
为什么被折叠?
被折叠的 条评论
为什么被折叠?
 到【灌水乐园】发言


