


python可以利用rasterio,cartopy,matplotlib等库绘制地形晕染图。
1.获取高程数据
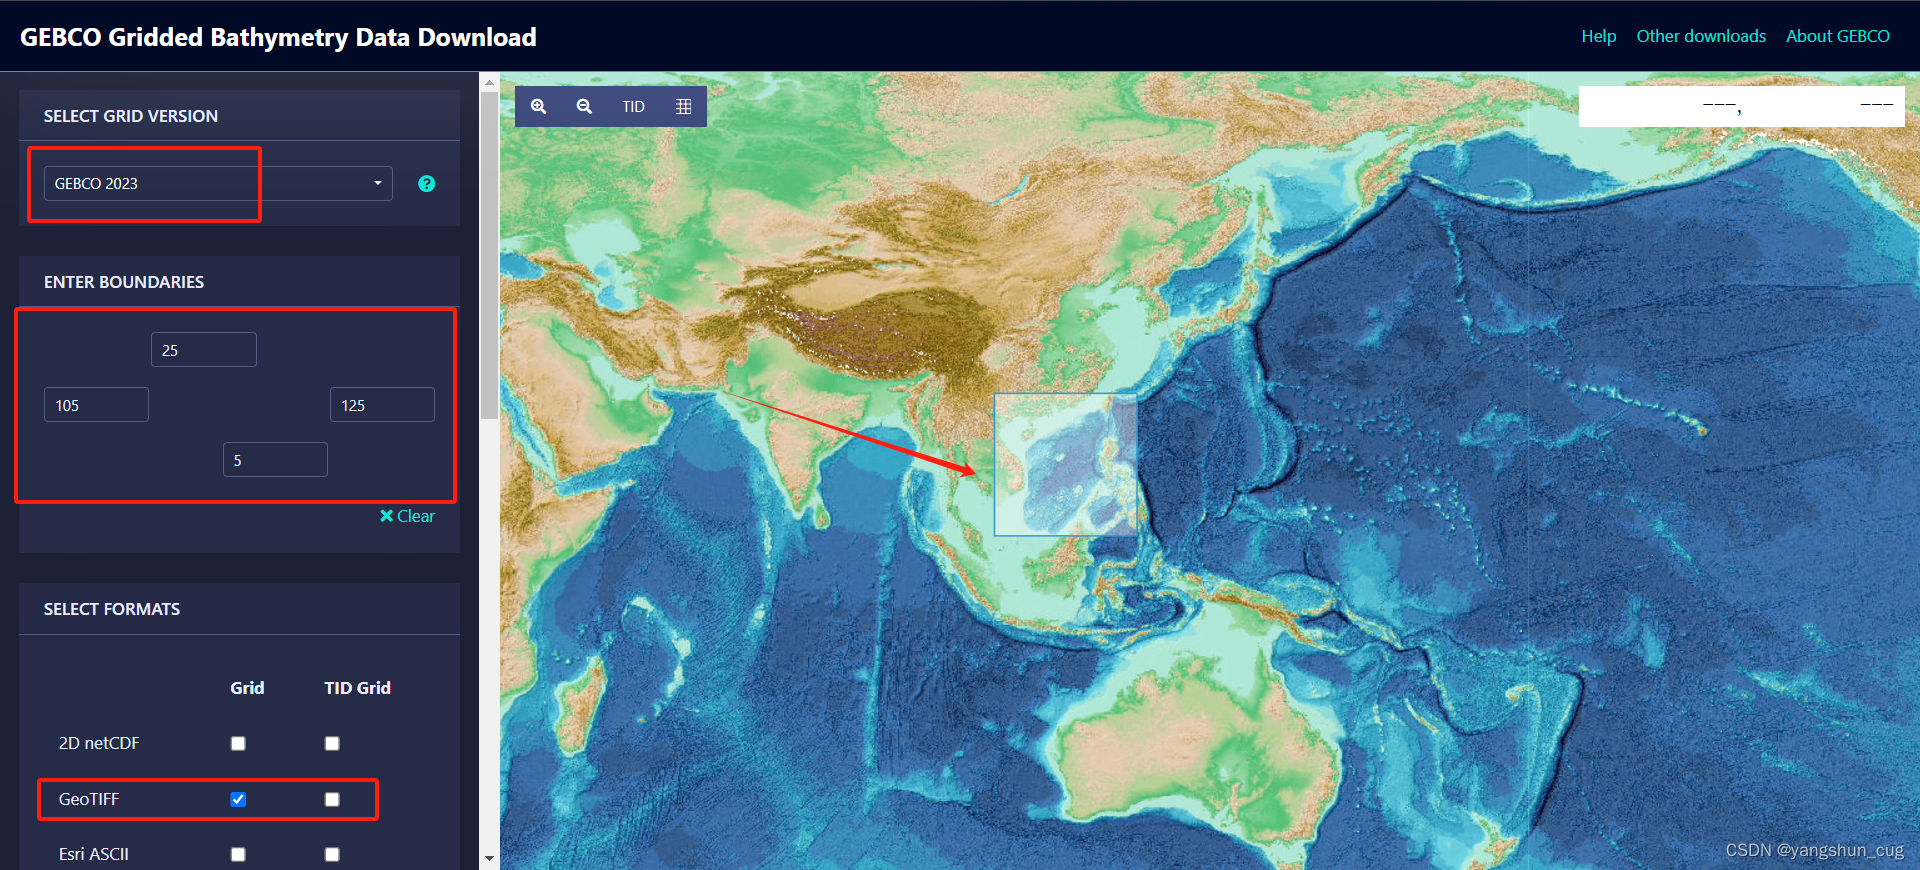
高程数据可以从GEBCO网站下载:(https://www.gebco.net/data_and_products/gridded_bathymetry_data/)。
选择raster(栅格)格式。下面以南海为例。
具体下载地址如下:https://download.gebco.net/。
这里选择最新的GEBCO2023数据库(这是15秒的全球高程数据),然后选择经纬度范围,Grid的GeoTIFF格式。
选择完后,可以直接下载。

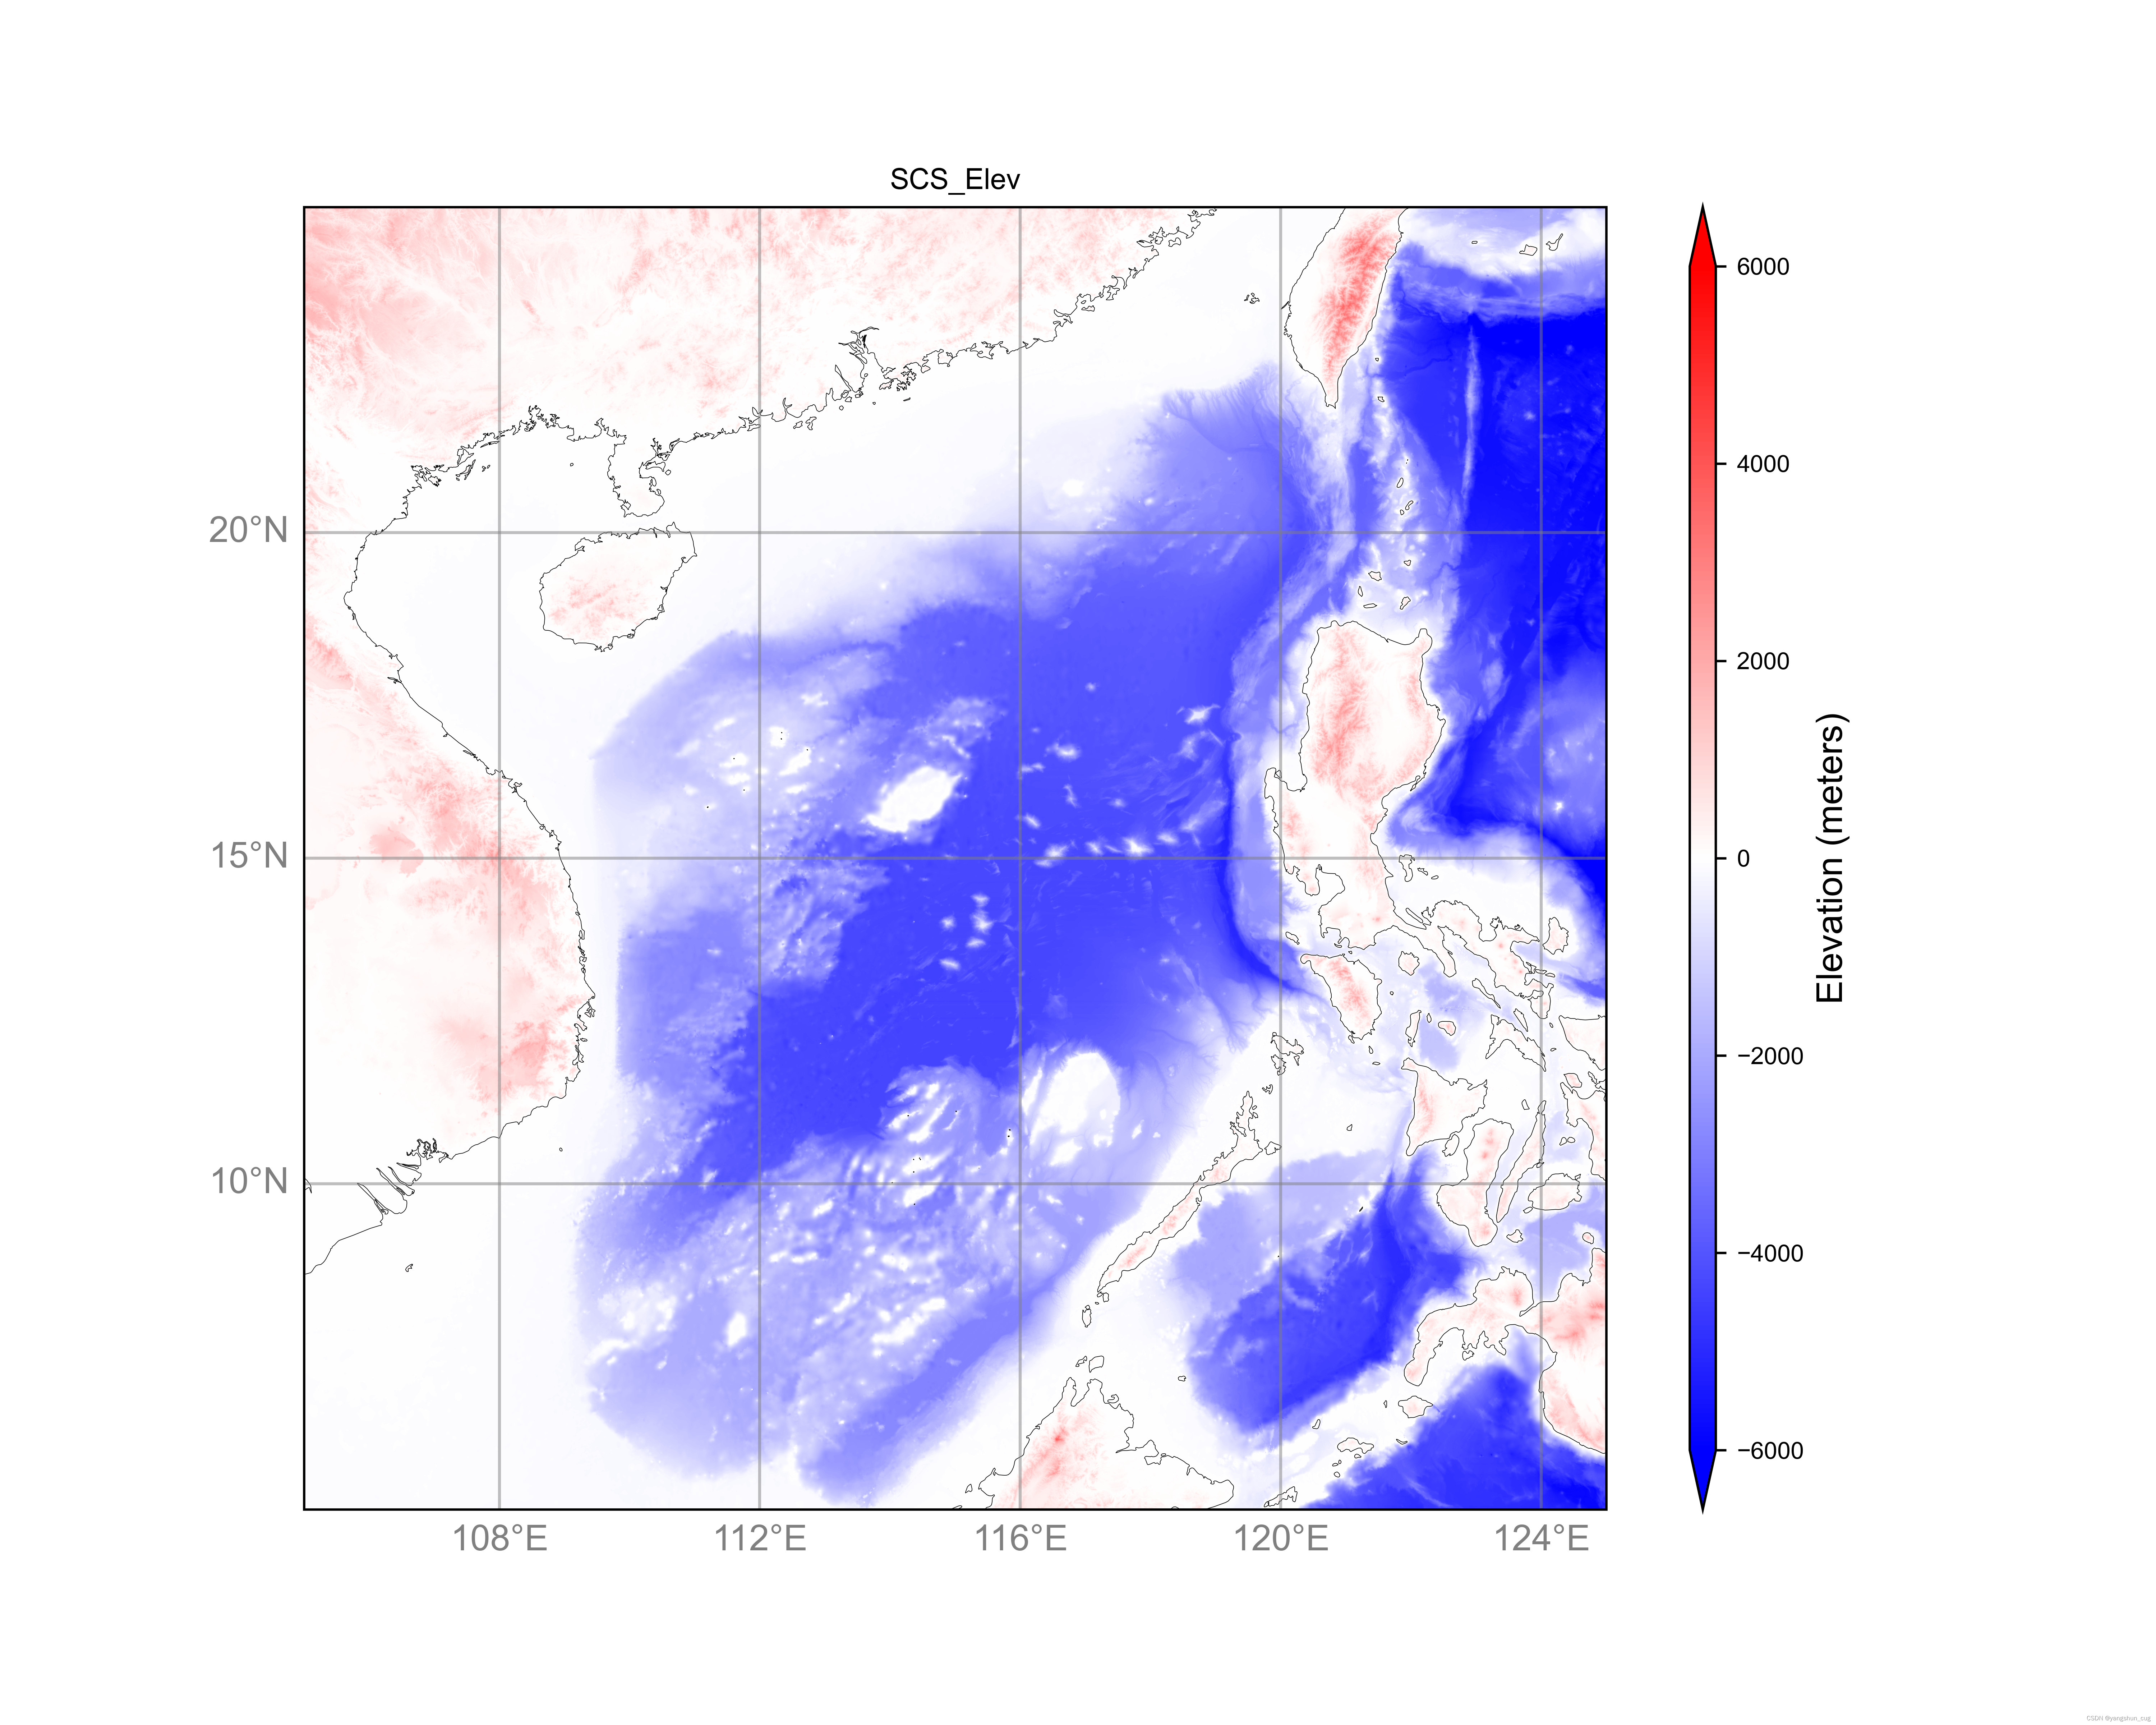
2. 高程图
首先显示高程图。
rasterio用于读取tiff格式的地理高程图。
高程图色标为bwr。
import rasterio
from rasterio.plot import show
import matplotlib.pyplot as plt
import cartopy.crs as ccrs
import numpy as np
from matplotlib.colors import Normalize

# 加载地理高程数据
file_path = 'gebco_2023_n25.0_s5.0_w105.0_e125.0.tif'

with rasterio.open(file_path) as src:
    elevation = src.read(1)  # 读取第一个波段
    transform = src.transform

# 获取地理边界
bounds = src.bounds
extent = [bounds.left, bounds.right, bounds.bottom, bounds.top]

# 创建图形和子图
fig = plt.figure(figsize=(10, 8))
ax = plt.axes(projection=ccrs.PlateCarree())

# 设置地图范围
ax.set_extent(extent, crs=ccrs.PlateCarree())
norm=Normalize(vmin=-6000,vmax=6000)
# 显示地理高程数据
img = ax.imshow(elevation, extent=extent, transform=ccrs.PlateCarree(), cmap='bwr',norm=norm)
cbar = plt.colorbar(img, orientation='vertical', pad=0.05, aspect=50,extend='both')
cbar.set_label('Elevation (meters)', fontsize=12)

# 添加海岸线和地理特征
ax.coastlines(resolution='10m',linewidth=0.2)
# ax.add_feature(cartopy.feature.BORDERS, linestyle=':')

# 添加经纬网
gl = ax.gridlines(draw_labels=True, linewidth=1, color='gray', alpha=0.5, linestyle='-')
gl.top_labels = False
gl.right_labels = False
gl.xlocator = plt.FixedLocator(np.arange(int(bounds.left), int(bounds.right) + 1, 4))
gl.ylocator = plt.FixedLocator(np.arange(int(bounds.bottom), int(bounds.top) + 1, 5))
gl.xlabel_style = {'size': 12, 'color': 'gray'}
gl.ylabel_style = {'size': 12, 'color': 'gray'}

# 显示图形
plt.title('Elevation Map of SCS')

outname='SCS_Elev'
plt.title('SCS_Elev')
plt.savefig(outname+'.png', format='png', dpi=600)
# plt.savefig(outname+'.pdf', format='pdf', dpi=600)
plt.show()
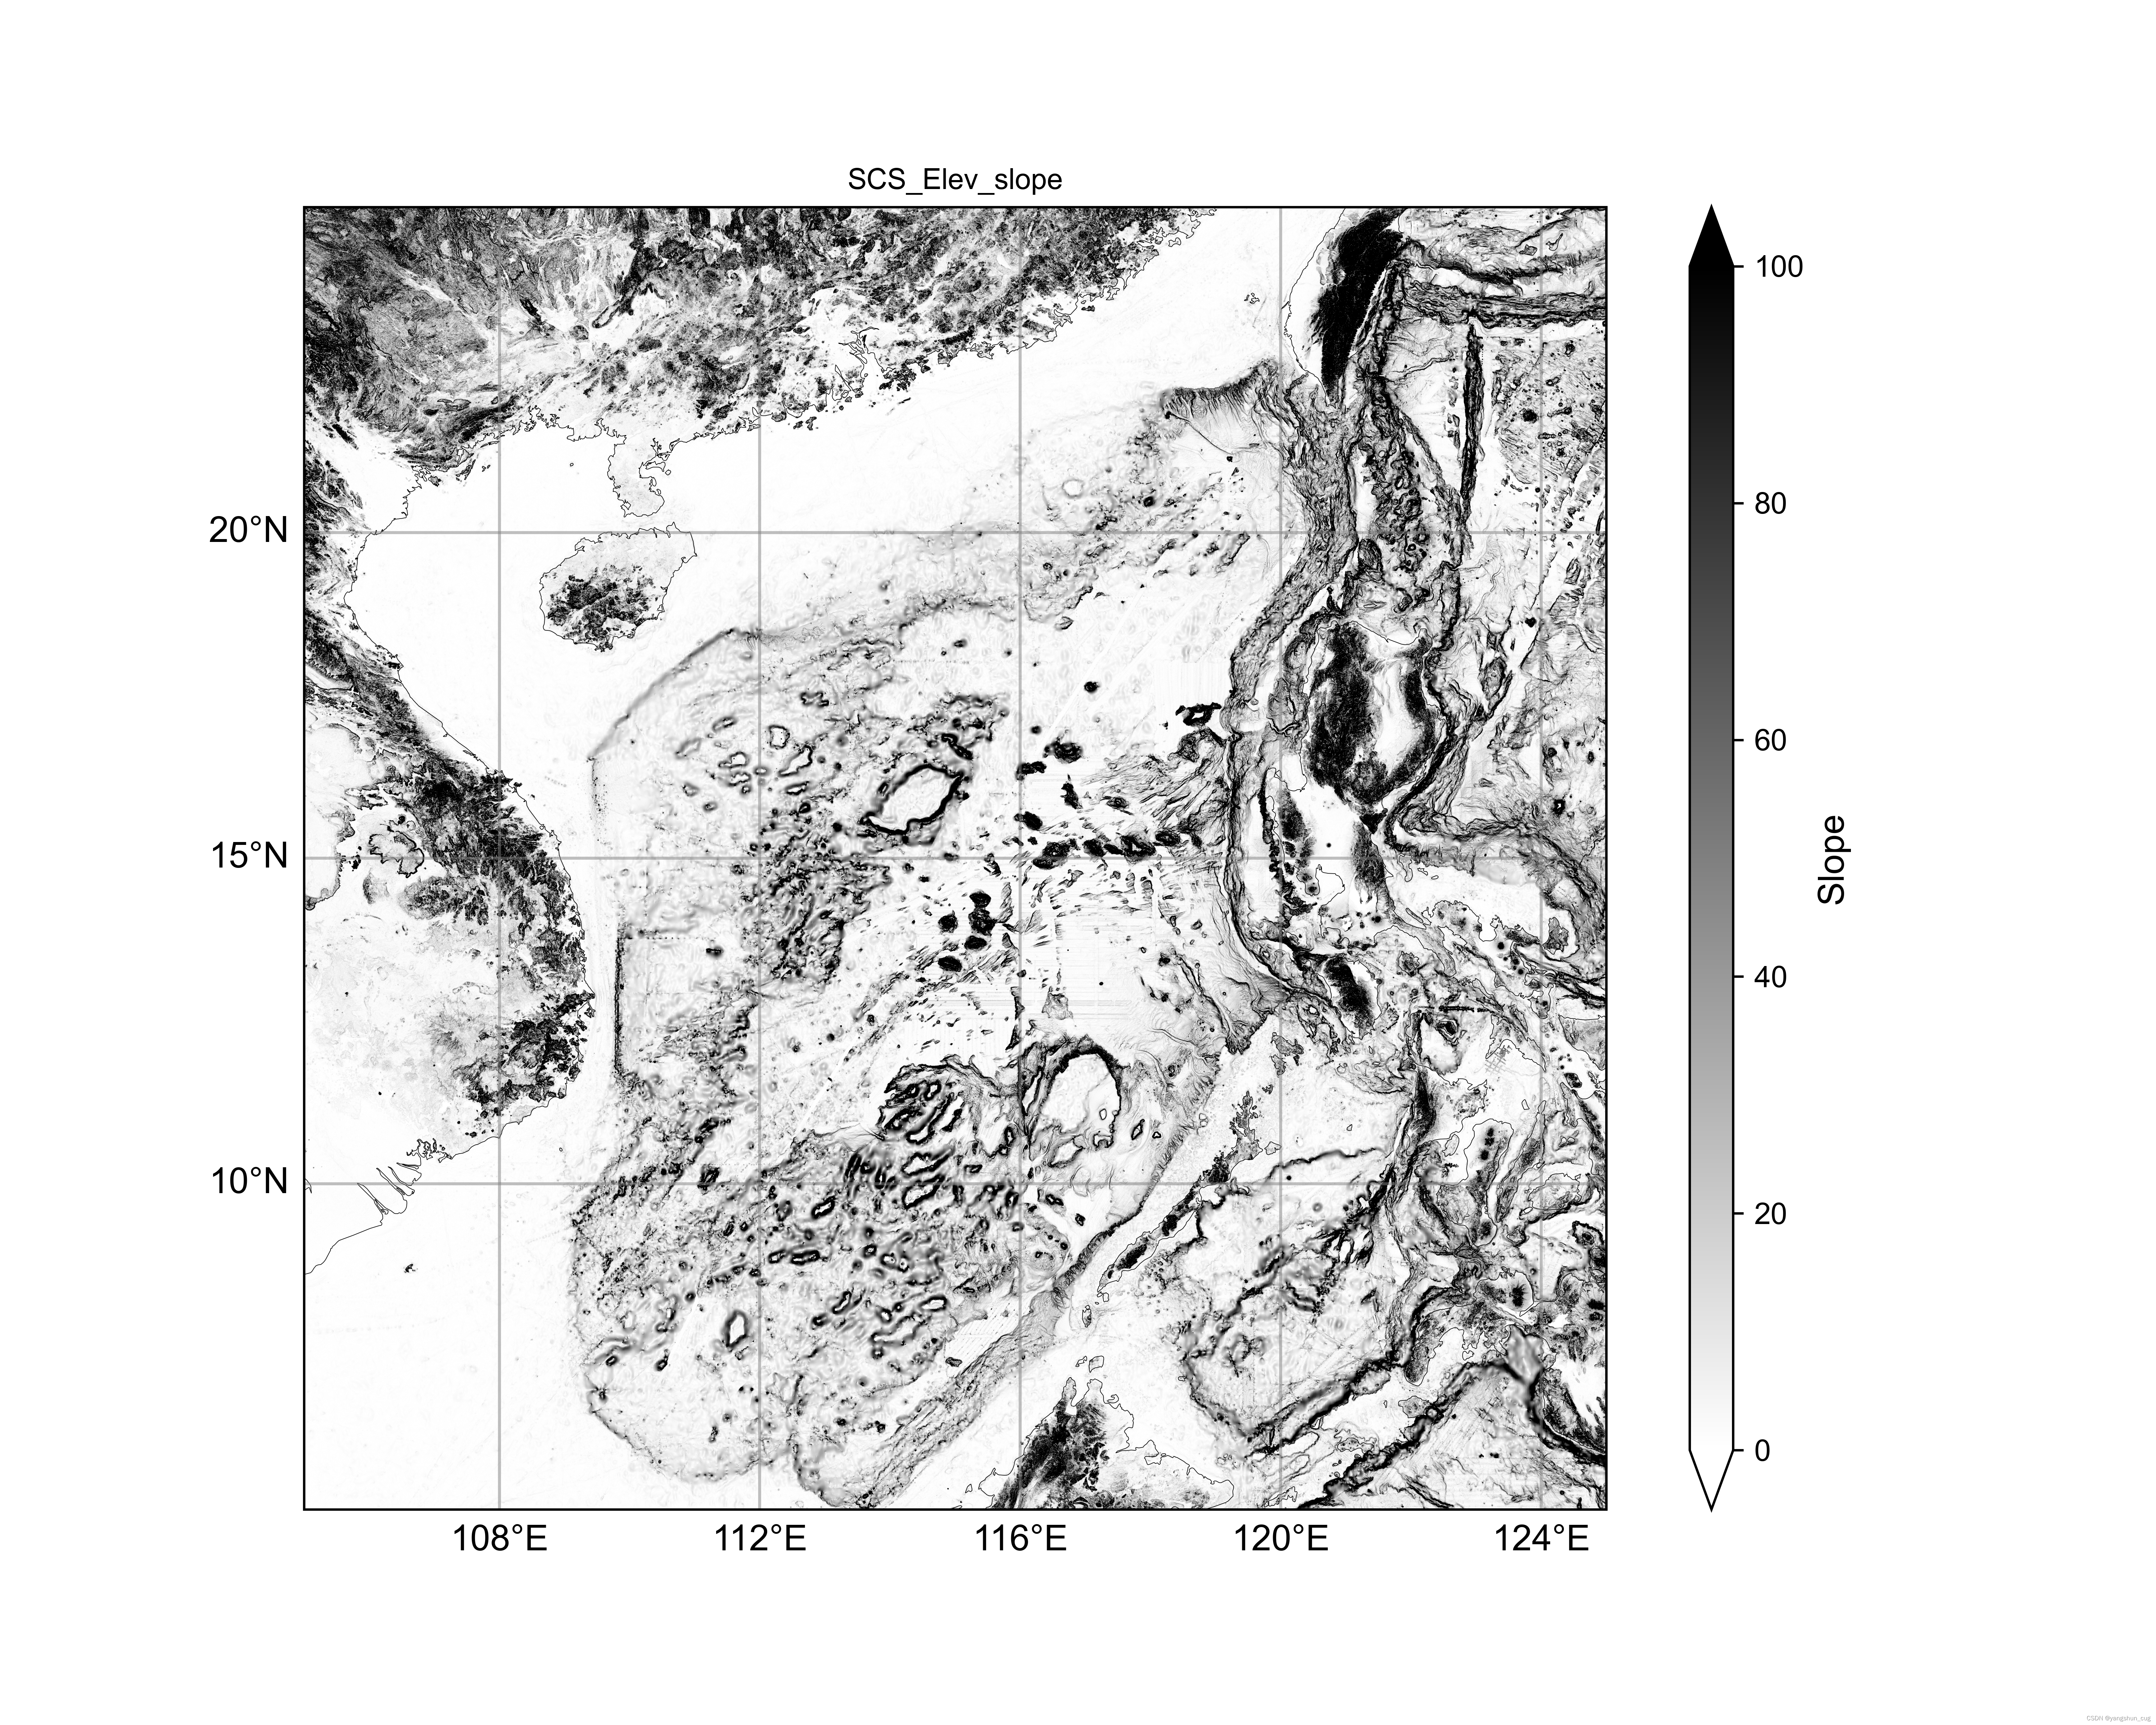
3.获取地形梯度图
然后计算地形的水平梯度(lon方向和lat方向)。
以梯度图为底图,使地形图更加立体。然后上覆高程图。
梯度地图色标为gray_r。
对于不同区域,色标范围可能需要调整。南海用[0, 100]比较合适。
# -*- coding: utf-8 -*-

import rasterio
import numpy as np
import matplotlib.pyplot as plt
import cartopy.crs as ccrs
from matplotlib.colors import Normalize

# 读取地理高程数据
file_path = './gebco_2023_n25.0_s5.0_w105.0_e125.0.tif'
with rasterio.open(file_path) as src:
    elevation = src.read(1)
    transform = src.transform
    bounds = src.bounds

# 获取地理边界
extent = [bounds.left, bounds.right, bounds.bottom, bounds.top]

# 创建图形和子图
fig, ax = plt.subplots(figsize=(10, 8), subplot_kw={'projection': ccrs.PlateCarree()})

# 设置地图范围
# ax.set_extent(extent, crs=ccrs.PlateCarree())

# 设置地形梯度增强立体感
grad_x, grad_y = np.gradient(elevation)
gradient_magnitude = np.sqrt(grad_x**2 + grad_y**2)

# 绘制地形数据
# norm = Normalize(vmin=-6000, vmax=6000)
shade_img = ax.imshow(gradient_magnitude, extent=extent, transform=ccrs.PlateCarree(),
                      cmap='gray_r', alpha=1, vmin=0, vmax=100)

cbar = plt.colorbar(shade_img, ax=ax, orientation='vertical', pad=0.05, aspect=30,extend='both')
cbar.set_label('Slope', fontsize=12)
cbar.ax.tick_params(labelsize=10)

# 添加海岸线和地理特征
ax.coastlines(resolution='10m',linewidth=0.2)
# ax.add_feature(cartopy.feature.BORDERS, linestyle=':')

# 添加经纬网
gl = ax.gridlines(draw_labels=True, linewidth=1, color='gray', alpha=0.5, linestyle='-')
gl.top_labels = False
gl.right_labels = False
gl.xlocator = plt.FixedLocator(np.arange(int(bounds.left), int(bounds.right) + 1, 4))
gl.ylocator = plt.FixedLocator(np.arange(int(bounds.bottom), int(bounds.top) + 1, 5))
gl.xlabel_style = {'size': 12, 'color': 'black'}
gl.ylabel_style = {'size': 12, 'color': 'black'}

# 显示图形
outname='SCS_Elev_slope'
# outname='SCS_Elev_shading'
plt.title(outname)
plt.savefig(outname+'.png', format='png', dpi=600)
# plt.savefig(outname+'.pdf', format='pdf', dpi=600)
plt.show()
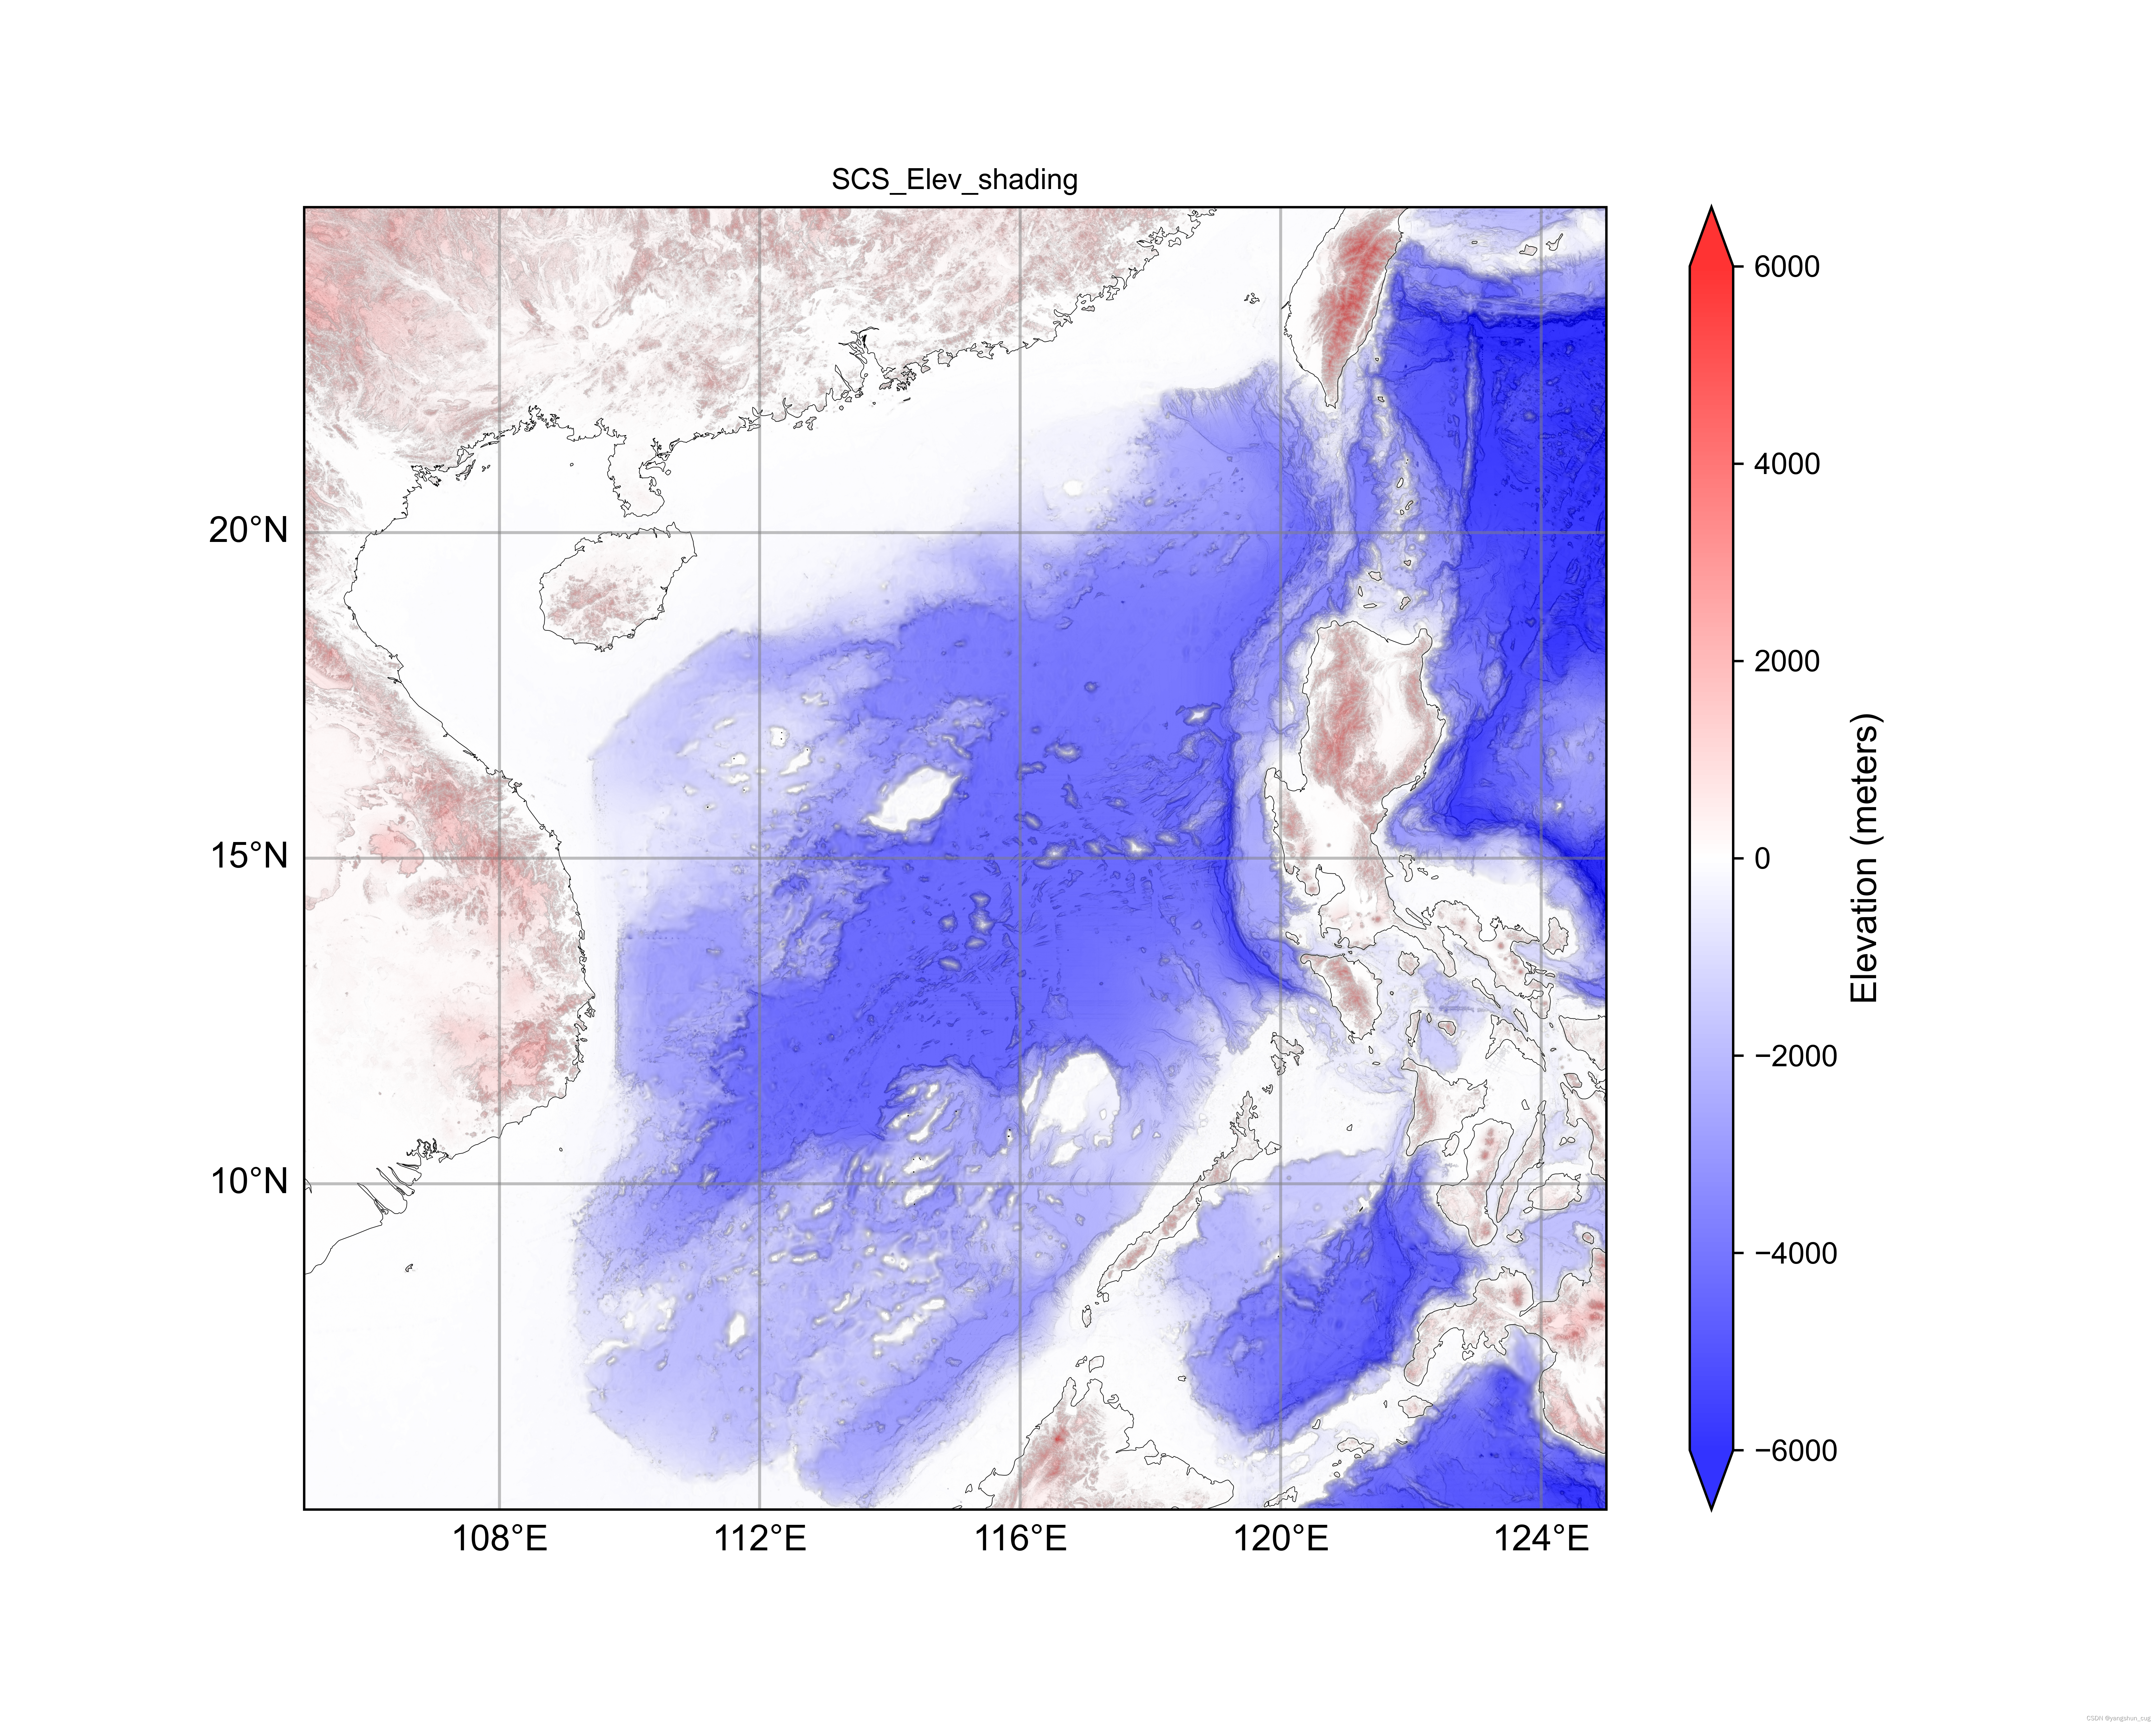
4. 叠加高程图和梯度图
以梯度图为底图,使地形图更加立体。然后上覆高程图。
梯度图色标为gray_r,高程图色标为bwr。注意设置色标范围。
# -*- coding: utf-8 -*-

import rasterio
import numpy as np
import matplotlib.pyplot as plt
import cartopy.crs as ccrs
from matplotlib.colors import Normalize

# 读取地理高程数据
file_path = './gebco_2023_n25.0_s5.0_w105.0_e125.0.tif'
with rasterio.open(file_path) as src:
    elevation = src.read(1)
    transform = src.transform
    bounds = src.bounds

# 获取地理边界
extent = [bounds.left, bounds.right, bounds.bottom, bounds.top]
# extent = [118,122,20,25]

# 创建图形和子图
fig, ax = plt.subplots(figsize=(10, 8), subplot_kw={'projection': ccrs.PlateCarree()})

# 设置地图范围
# ax.set_extent(extent, crs=ccrs.PlateCarree())

# 设置地形梯度增强立体感
grad_x, grad_y = np.gradient(elevation)
gradient_magnitude = np.sqrt(grad_x**2 + grad_y**2)

# 绘制地形数据
norm = Normalize(vmin=-6000, vmax=6000)
shade_img = ax.imshow(gradient_magnitude, extent=extent, transform=ccrs.PlateCarree(),
                      cmap='gray_r', alpha=1, vmin=0, vmax=100)

terrain_img = ax.imshow(elevation, extent=extent, transform=ccrs.PlateCarree(),
                        cmap='bwr', norm=norm, alpha=0.8)


# 添加颜色条并设置范围
cbar = plt.colorbar(terrain_img, ax=ax, orientation='vertical', pad=0.05,
                    aspect=30,extend='both')
cbar.set_label('Elevation (meters)', fontsize=12)
cbar.ax.tick_params(labelsize=10)

# 添加海岸线和地理特征
ax.coastlines(resolution='10m',linewidth=0.2)
# ax.add_feature(cartopy.feature.BORDERS, linestyle=':')

# 添加经纬网
gl = ax.gridlines(draw_labels=True, linewidth=1, color='gray', alpha=0.5, linestyle='-')
gl.top_labels = False
gl.right_labels = False
gl.xlocator = plt.FixedLocator(np.arange(int(bounds.left), int(bounds.right) + 1, 4))
gl.ylocator = plt.FixedLocator(np.arange(int(bounds.bottom), int(bounds.top) + 1, 5))
gl.xlabel_style = {'size': 12, 'color': 'black'}
gl.ylabel_style = {'size': 12, 'color': 'black'}

# 显示图形
outname='SCS_Elev_shading'
plt.title(outname)
plt.savefig(outname+'.png', format='png', dpi=600)
# plt.savefig(outname+'.pdf', format='pdf', dpi=600)
plt.show()


 1万+
1万+

 被折叠的 条评论
为什么被折叠?
被折叠的 条评论
为什么被折叠?
 到【灌水乐园】发言


