销售预测
环境说明:
- 项目描述: 投放金额与销售额预测
- 作者: 贪心学院 出品
- 基础环境:Python3.6
- 依赖库:pandas、Matplotlib、sklearn、numpy
- 输入数据: data.txt
- 程序输出目标:要对销售额进行预测
- 模型应用: 线性回归
- 环境安装基本命令: pip install pandas 或 matplotlib 或 sklearn
- 应用软件: jupyter notebook 安装方式 pip install jupyter
代码
#导入库
import pandas as pd
from matplotlib import pyplot as plt
from sklearn import linear_model
from sklearn.metrics import mean_squared_error
#读取数据
data =pd.read_csv("data.txt")
# print(data)
# dat=np.array(
# [
# [1,2,3],[2,3,4]
# ])
# print(dat.shape[0])
#数据预处理
num=int(data.shape[0]*0.7)
# print(num)
x,y=data[
["money"]
],data[
["amount"]
]
#0.7为训练集
x_train,x_test=x[:num],x[num:]
y_train,y_test=y[:num],y[num:]
#数据探索性分析
plt.scatter(x_train,y_train)
<matplotlib.collections.PathCollection at 0x1e72f95e4a8>
#数据建模
model=linear_model.LinearRegression()
model.fit(x_train,y_train)
LinearRegression(copy_X=True, fit_intercept=True, n_jobs=1, normalize=False)
#模型评估
predict_test_y=model.predict(x_test)
print("MSE均方误差是:%.2f"%mean_squared_error(y_test,predict_test_y))
#预测
(
import numpy as np
new_x=np.array([[84632]])
pre_y=model.predict(new_x)
print(pre_y)
项目笔记:
model=linear_model.LinearRegression()
model.fit(x_train,y_train)
- 均方误差公式:
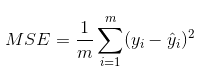
- 均方误差是指参数估计值与参数真值之差平方的期望值,记为MSE。MSE是衡量平均误差的一种较方便的方法,MSE可以评价数据的变化程度,MSE的值越小,说明预测模型描述实验数据具有更好的精确度。
-
mean_squared_error(y_test,predict_test_y)
pre_y=model.predict(new_x)
回归模型评估:
回归模型评估


 4163
4163


 被折叠的 条评论
为什么被折叠?
被折叠的 条评论
为什么被折叠?
 到【灌水乐园】发言


