干预分析模型 - GDP预测
加载pandas、matplotlib等包,处理时间序列
import pandas as pd
import numpy as np
import matplotlib.pylab as plt
%matplotlib inline
plt.rcParams['axes.unicode_minus'] = False
plt.rcParams['font.sans-serif'] = ['Simhei']
from matplotlib.pylab import rcParams
rcParams['figure.figsize'] = 15, 6
import warnings
warnings.filterwarnings("ignore")
读入数据
data = pd.read_csv('China GDP 1980-2016.csv')
data.head()
|
Year |
GDP |
| 0 |
2016 |
743585.5 |
| 1 |
2015 |
689052.1 |
| 2 |
2014 |
643974.0 |
| 3 |
2013 |
595244.4 |
| 4 |
2012 |
540367.4 |
data.dtypes
Year      int64
GDP     float64
dtype: object
data.columns
Index(['Year', 'GDP'], dtype='object')
Year 是int64类型,在时间序列分析中,我们需要现将数据转化为时间序列
dateparse = lambda dates: pd.datetime.strptime(dates, '%Y')
dateparse('1962')
datetime.datetime(1962, 1, 1, 0, 0)
df = pd.read_csv('China GDP 1980-2016.csv', parse_dates=['Year'], index_col='Year', date_parser=dateparse)
df.head()
|
GDP |
| Year |
|
| 2016-01-01 |
743585.5 |
| 2015-01-01 |
689052.1 |
| 2014-01-01 |
643974.0 |
| 2013-01-01 |
595244.4 |
| 2012-01-01 |
540367.4 |
df.index
DatetimeIndex(['2016-01-01', '2015-01-01', '2014-01-01', '2013-01-01',
               '2012-01-01', '2011-01-01', '2010-01-01', '2009-01-01',
               '2008-01-01', '2007-01-01', '2006-01-01', '2005-01-01',
               '2004-01-01', '2003-01-01', '2002-01-01', '2001-01-01',
               '2000-01-01', '1999-01-01', '1998-01-01', '1997-01-01',
               '1996-01-01', '1995-01-01', '1994-01-01', '1993-01-01',
               '1992-01-01', '1991-01-01', '1990-01-01', '1989-01-01',
               '1988-01-01', '1987-01-01', '1986-01-01', '1985-01-01',
               '1984-01-01', '1983-01-01', '1982-01-01', '1981-01-01',
               '1980-01-01'],
              dtype='datetime64[ns]', name='Year', freq=None)
ts = df['GDP'].sort_index()
ts.head()
Year
1980-01-01    4587.6
1981-01-01    4935.8
1982-01-01    5373.4
1983-01-01    6020.9
1984-01-01    7278.5
Name: GDP, dtype: float64
拆分数据为训练集和测试集
min(ts.index), max(ts.index)
(Timestamp('1980-01-01 00:00:00'), Timestamp('2016-01-01 00:00:00'))
train = ts['1980':'1997']
test = ts['1998':'2006']
平稳性检验
绘制时序图
train.plot(figsize=(20,6), fontsize=14, label="train")
test.plot(figsize=(20,6), title= 'GDP', fontsize=14, label="test")
plt.show()
[外链图片转存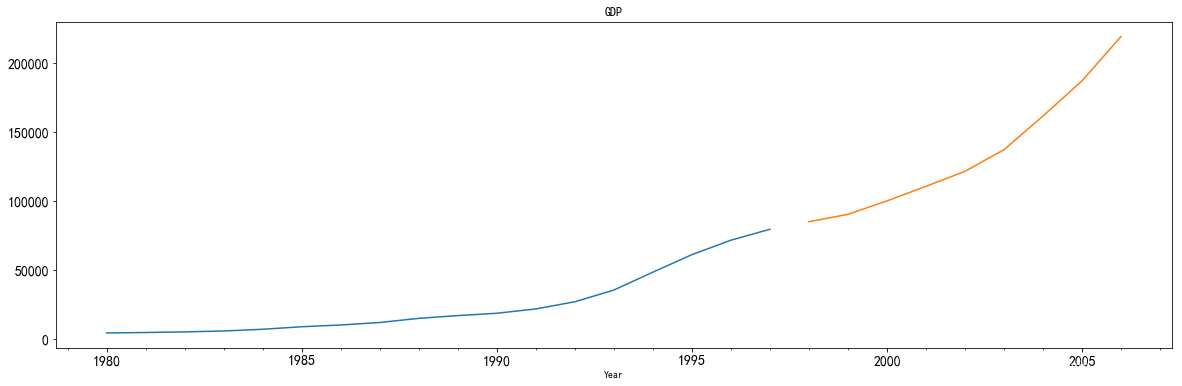 (img-xLpGUy3F-1562729294200)(output_16_0.png)]
平稳性检验
from statsmodels.tsa.stattools import adfuller
def test_stationarity(timeseries):
print('Results of Dickey-Fuller Test:')
dftest = adfuller(timeseries, autolag='AIC')
dfoutput = pd.Series(dftest[0:4], index=['Test Statistic','p-value','#Lags Used','Number of Observations Used'])
for key,value in dftest[4].items():
dfoutput['Critical Value ({})'.


 这篇博客探讨了如何运用干预分析模型预测中国的GDP。首先,通过加载pandas和matplotlib等库处理时间序列数据,并将Year字段转化为时间序列。接着,数据被划分为训练集和测试集。在平稳性检验中,发现原始序列非平稳,因此进行了指数变换和差分处理。随后,使用ARMA模型进行拟合,并将预测值还原为指数变换前的形式。最后,对比了AR模型的预测效果。
 最低0.47元/天 解锁文章


 4245
4245

 被折叠的 条评论
为什么被折叠?
被折叠的 条评论
为什么被折叠?
 到【灌水乐园】发言


