


1.数据收集
根据分析所需内容,搜集以下数据:
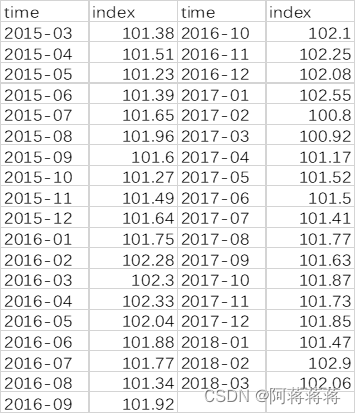
2015年到2018年cpi指数月度数据
(数据来源:中经网统计数据库)
2.数据整理
将以上数据整理成表:
3.时间序列对象
本数据分析将使用R stdio 3.4.4。
4. .绘制时间序列图
(一)绘制原始GDP序列的时序图
(1)编程
| > da<-read.xlsx("C:/Users/26259/Documents/R/da.xlsx") > dim(da) [1] 37 2 > head(da) year index 1 2015-03 101.38 2 2015-04 101.51 3 2015-05 101.23 4 2015-06 101.39 5 2015-07 101.65 6 2015-08 101.96 > index=log(da$index+1) > rtn=ts(index,frequency = 12,start = c(2015,3))(时间刻度) > plot(rtn,xlab='year',ylab='ln-rtn') |

从图中可以看出居民消费价格指数具有明显的单调递增趋势,可以初步判断为非平稳序列。
(二)自相关性检验
(1)编程
acf(index,lag.max = 30)
> t.test(index)
One Sample t-test
data: index
t = 6563.6, df = 36, p-value < 2.2e-16
alternative hypothesis: true mean is not equal to 0
95 percent confidence interval:
4.630743 4.633605
sample estimates:
mean of x
4.632174
 最低0.47元/天 解锁文章


 1456
1456


 被折叠的 条评论
为什么被折叠?
被折叠的 条评论
为什么被折叠?
 到【灌水乐园】发言


